
Goal of the analysis:
The goal of Visual Merchandising Performance Analysis is to evaluate how effectively a retail company’s visual displays and product arrangements impact customer engagement and sales. This analysis measures the impact of in-store displays, window setups, and promotional layouts on driving traffic, increasing dwell time, and boosting sales conversion rates.
Data required:
- Sales data by product and category (before and after merchandising changes).
- Foot traffic data (number of visitors per day or week).
- Conversion rate (percentage of visitors who make purchases).
- Customer dwell time data in high-visibility areas (optional).
- Promotional or display-related event data (optional for tracking specific campaigns).
- Customer feedback on store displays (optional).
- Stock or inventory movement data (optional for tracking how quickly displayed products sell).
Detailed step-by-step instruction on how to conduct the analysis:
1. Collect baseline sales and foot traffic data.
Begin by gathering sales data for products and categories before making any changes to visual merchandising. Combine this with foot traffic data to establish how many customers are visiting the store or specific display areas.
2. Monitor product movement in display areas.
Identify key products featured in prominent visual displays (e.g., window displays, endcaps, or promotional tables) and track their sales performance.
Calculate the rate at which these products sell using the following formula:
Sales Rate = Total Units Sold / Days in Display
This will provide insight into how quickly products in visual displays are moving compared to non-displayed products.
3. Measure foot traffic and conversion rates in key areas.
Use in-store sensors or traffic counters to measure foot traffic in areas where visual merchandising is prominent.
Calculate the conversion rate to assess how effectively displays are driving purchases:
Conversion Rate (%) = (Number of Transactions / Number of Visitors) x 100
This will help determine whether visually appealing displays lead to actual purchases.
4. Calculate the impact on sales.
Compare sales data before and after the visual merchandising changes to determine whether there was an increase in sales:
Sales Lift (%) = ((Sales After Merchandising Change – Sales Before Merchandising Change) / Sales Before Merchandising Change) x 100
This provides a clear measure of whether the visual merchandising improvements positively impacted revenue.
5. Analyze customer dwell time in display areas (optional).
If possible, track how long customers spend in front of key visual displays using in-store sensors or cameras. Longer dwell times may indicate that customers are engaging more deeply with the products or displays.
6. Gather customer feedback (optional).
Use customer surveys or feedback tools to gather insights on how customers perceive the visual displays. Ask questions related to visual appeal, product visibility, and whether the displays influenced their decision to purchase.
7. Track inventory turnover for displayed products (optional).
For products prominently featured in visual merchandising, track inventory turnover rates to see how quickly stock is selling.
Inventory Turnover = Cost of Goods Sold / Average Inventor
A higher turnover rate for displayed products may indicate that visual merchandising is effectively driving sales.
Potential complications that can arise with this analysis:
- External factors: Changes in sales may be influenced by factors outside of visual merchandising (e.g., promotions, seasonality, economic conditions), complicating attribution.
- Inconsistent data collection: Foot traffic and conversion rate data may be inconsistent or unavailable, making it difficult to measure performance accurately.
- Customer variability: Different customer segments may respond differently to visual merchandising, so results may not be uniform across all stores or regions.
- Product or inventory limitations: Limited stock availability for featured products could skew the analysis, making it appear that visual merchandising is less effective than it is.
Format of the output of analysis:
The output typically includes a comparison of sales performance, foot traffic, conversion rates, and product movement before and after visual merchandising changes. The results can be presented in tables or charts to make trends and impact easier to interpret.
Example output:
- Product A (featured in window display):
- Sales before display: 100 units/month
- Sales after display: 200 units/month
- Foot traffic increase: +15%
- Conversion rate: 10%
- Sales lift: +100%
- Product B (featured on endcap):
- Sales before display: 50 units/month
- Sales after display: 70 units/month
- Sales lift: +40%
How to interpret results:
- High sales lift and conversion rates: A significant increase in sales and conversion rates for products featured in visual displays indicates that the merchandising is effective in driving customer interest and purchases.
- Increased foot traffic without higher conversion rates: If foot traffic increases but conversion rates stay flat or decline, this may indicate that the displays are attracting attention but are not persuading customers to make a purchase.
- Longer dwell times with higher sales: Increased dwell time in front of visual displays correlates with increased sales, suggesting that engaging displays can effectively capture customer interest and influence purchasing decisions.
- Low product movement despite prominent display: If products in key display areas are not selling as expected, consider reevaluating the product selection or improving the visual merchandising strategy.
Steps a company can take to improve on this measure:
- Enhance visual appeal: Focus on creating visually striking and organized displays that catch customer attention and highlight key products. Use color, lighting, and signage to guide customer focus.
- Place high-margin or high-demand products in prominent locations: Use prime display areas like window displays, endcaps, and promotional tables to feature products that are either high-margin or in high demand.
- Update displays regularly: Rotate visual displays frequently to keep the store looking fresh and relevant. Stagnant displays may lose their impact over time and fail to engage repeat visitors.
- Use data-driven insights: Use sales data to inform which products or categories perform best when visually featured. Focus merchandising efforts on those products to maximize impact.
- Incorporate storytelling in displays: Use displays to tell a cohesive story around product themes, seasons, or trends. Engaging customers emotionally can make visual merchandising more effective.
- Leverage digital displays: Where possible, integrate digital signage or interactive displays to engage customers further and provide dynamic information about products.
- Train staff on visual merchandising principles: Ensure store employees understand the importance of visual merchandising and are trained to maintain and adjust displays as needed.
Request the PDF Download of How to Analyze a Retail Company
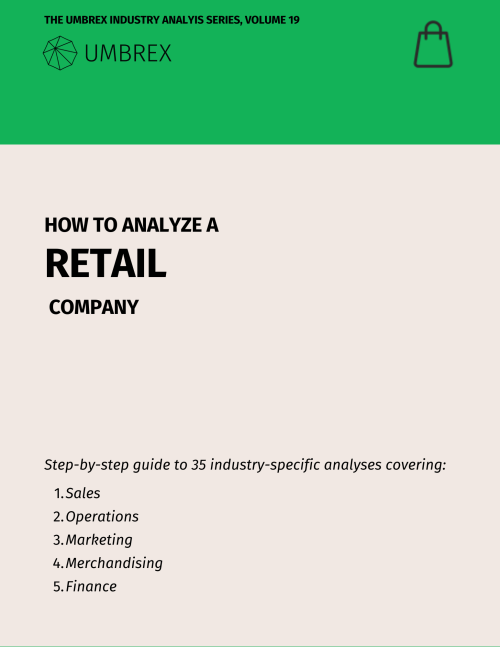
Menu of the 35 analyses:
Sales:
- Comparable Store Sales Analysis
- Cross-Selling and Up-Selling Effectiveness
- Customer Lifetime Value
- Customer Return Rate Analysis
- Foot Traffic and Conversion Rate Analysis
- Location-Based Performance Analysis
- Omnichannel Strategy Effectiveness
- Seasonality Impact and Sales Mix Analysis
- Store Atmosphere and Experience Impact on Sales
Operations:
- Click-and-Collect/Buy Online, Pickup In-Store (BOPIS) Effectiveness
- E-commerce Fulfillment Efficiency and Cost Analysis
- In-Stock Rate and Out-of-Stock Analysis
- Inventory Turnover and Management Analysis
- Shelf Space Allocation and Optimization
- Store Closure and Rationalization Analysis
- Store Expansion and Cannibalization Risk Analysis
- Store Labor Productivity Analysis
- Store Lease and Real Estate Cost Efficiency
- Sustainability and Ethical Sourcing in Retail
Marketing:
Merchandising:
- Markdown Strategy and Effectiveness
- Merchandising Strategy Effectiveness
- Planogram Compliance and Store Layout Efficiency, including Endcap Performance
- Private Label vs. Branded Product Performance and Supplier Dependency Strategy
- Product Category Margin Analysis
- Stock Keeping Unit (SKU) Rationalization and Retail Product Assortment Optimization
- Visual Merchandising Performance