
Goal of the analysis:
The goal of Merchandising Strategy Effectiveness Analysis is to evaluate how well a retail company’s merchandising strategy is driving sales, enhancing customer satisfaction, and optimizing product placement. This analysis helps retailers assess whether the product assortment, pricing, promotions, and visual displays are effectively aligned with customer demand and profitability goals.
Data required:
- Sales data by product, category, and time period.
- Inventory data, including stock levels and turnover rates.
- Gross profit margins for each product or category.
- Promotional data (e.g., discounts, offers, and sales events).
- Customer feedback or satisfaction data (optional for deeper insights).
- Foot traffic and customer conversion rates (optional for understanding the effectiveness of product placement).
- Visual merchandising display data (optional, for tracking display performance).
Detailed step-by-step instruction on how to conduct the analysis:
1. Collect sales and inventory data.
Gather sales and inventory data for each product or category over a specified period (e.g., monthly, quarterly). This will provide insights into how well the merchandising strategy is driving sales and managing inventory.
2. Calculate sales growth by product or category:
Measure the sales growth for each product or category to assess whether specific merchandising tactics (e.g., placement, promotions) are increasing revenue.
Use this equation:
Sales Growth (%) = ((Sales in Current Period – Sales in Previous Period) / Sales in Previous Period) x 100
This provides a measure of the effectiveness of the merchandising strategy in increasing sales.
3. Analyze gross profit margins.
Evaluate the profitability of each product or category by calculating the gross profit margin:
Gross Profit Margin (%) = ((Sales – Cost of Goods Sold) / Sales) x 100
High-profit margins may indicate that the merchandising strategy is effectively driving high-margin product sales.
4. Measure inventory turnover.
Analyze how quickly products are selling and being replenished to assess merchandising efficiency.
Use the following formula:
Inventory Turnover = (Cost of Goods Sold / Average Inventory)
High inventory turnover indicates that products are moving quickly, while low turnover may suggest overstocking or ineffective merchandising.
5. Evaluate promotional effectiveness:
Assess the impact of promotions on sales by comparing the sales of promoted products to non-promoted products or periods without promotions.
Promotion Lift (%) = ((Sales During Promotion – Sales Before Promotion) / Sales Before Promotion) x 100
This shows the incremental sales generated by the promotion.
6. Analyze product placement and display performance (optional).
If foot traffic or customer flow data is available, analyze how product placement impacts sales.
Compare the performance of products in high-visibility areas (e.g., endcaps, window displays) to those in less prominent areas.
Sales per Display Area = Total Sales from Display Area / Square Footage of Display Area
This helps assess whether prime merchandising areas are being used effectively.
7. Review customer feedback (optional).
Use customer feedback or satisfaction surveys to understand how customers perceive product availability, pricing, and overall merchandising. This can help identify areas where the strategy may not align with customer preferences.
Potential complications that can arise with this analysis:
- Seasonal fluctuations: Sales may fluctuate due to seasonal demand, which can distort the effectiveness of the merchandising strategy. Seasonal adjustments should be made in the analysis.
- Promotional overlap: Multiple promotions running simultaneously may make it difficult to isolate the effect of a specific merchandising tactic.
- Incomplete data: Missing or inaccurate inventory and sales data can lead to incorrect conclusions about merchandising performance.
- Changing customer preferences: Customer preferences may shift over time, which could lead to previously effective merchandising strategies becoming less effective.
Format of the output of analysis:
The output typically includes key metrics such as sales growth, gross profit margins, inventory turnover, and promotional lift. These metrics are often presented in tables, charts, or reports for each product or category.
Example output:
- Sales growth for Q2 2024:
- Apparel: +15%
- Electronics: +10%
- Home goods: +5%
- Gross profit margin by category:
- Apparel: 40%
- Electronics: 35%
- Home goods: 25%
- Inventory turnover:
- Apparel: 5.5
- Electronics: 4.0
- Home goods: 3.2
- Promotion lift for Product X: +20%
How to interpret results:
- High sales growth and profit margins: Indicate that the merchandising strategy is effectively driving sales and promoting high-margin products. The strategy is likely well-aligned with customer demand.
- Low inventory turnover: Suggests that the merchandising strategy may not be moving products efficiently, leading to overstocking or slow-moving items.
- High promotional lift: Shows that promotions are successfully boosting sales, but this should be balanced against the cost of discounts to ensure profitability.
- Customer feedback alignment: Positive customer feedback on product availability, pricing, and displays indicates that the merchandising strategy is meeting customer expectations. Negative feedback highlights areas for improvement.
Steps a company can take to improve on this measure:
- Refine product placement: Based on sales and foot traffic data, adjust product placement to prioritize high-margin and fast-moving products in prime display areas.
- Optimize inventory levels: Improve inventory management for slow-moving products by reducing stock levels and focusing on higher-demand items.
- Enhance promotional strategies: Focus promotions on high-margin or high-demand products to maximize the return on investment while avoiding over-discounting.
- Tailor merchandising to customer preferences: Use customer feedback to adjust product assortment and displays to better align with customer needs and preferences.
- Improve data collection and monitoring: Ensure accurate and timely data collection for sales, inventory, and customer behavior to enable more precise analysis and faster decision-making.
- Test new merchandising tactics: Experiment with new display strategies, promotions, or product assortments in a few stores or sections to evaluate their effectiveness before scaling up.
Request the PDF Download of How to Analyze a Retail Company
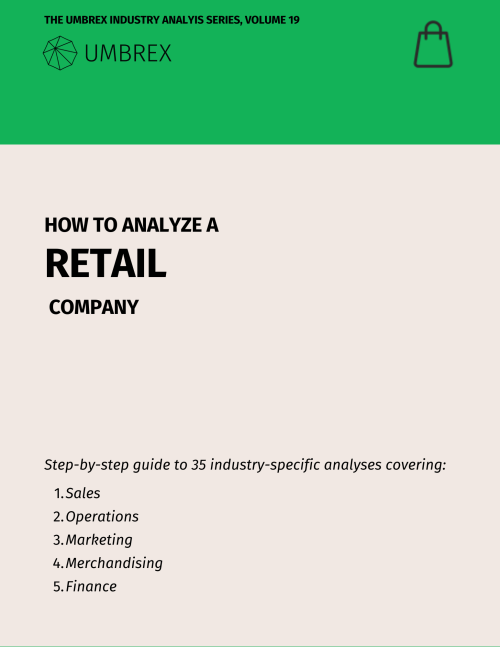
Menu of the 35 analyses:
Sales:
- Comparable Store Sales Analysis
- Cross-Selling and Up-Selling Effectiveness
- Customer Lifetime Value
- Customer Return Rate Analysis
- Foot Traffic and Conversion Rate Analysis
- Location-Based Performance Analysis
- Omnichannel Strategy Effectiveness
- Seasonality Impact and Sales Mix Analysis
- Store Atmosphere and Experience Impact on Sales
Operations:
- Click-and-Collect/Buy Online, Pickup In-Store (BOPIS) Effectiveness
- E-commerce Fulfillment Efficiency and Cost Analysis
- In-Stock Rate and Out-of-Stock Analysis
- Inventory Turnover and Management Analysis
- Shelf Space Allocation and Optimization
- Store Closure and Rationalization Analysis
- Store Expansion and Cannibalization Risk Analysis
- Store Labor Productivity Analysis
- Store Lease and Real Estate Cost Efficiency
- Sustainability and Ethical Sourcing in Retail
Marketing:
Merchandising:
- Markdown Strategy and Effectiveness
- Merchandising Strategy Effectiveness
- Planogram Compliance and Store Layout Efficiency, including Endcap Performance
- Private Label vs. Branded Product Performance and Supplier Dependency Strategy
- Product Category Margin Analysis
- Stock Keeping Unit (SKU) Rationalization and Retail Product Assortment Optimization
- Visual Merchandising Performance