
Goal of the analysis:
The goal of the Inventory Turnover and Management Analysis is to evaluate how efficiently a retail company is managing its inventory. This analysis measures how many times inventory is sold and replaced over a specific period. High inventory turnover suggests efficient management, while low turnover can indicate overstocking or slow-moving goods.
Data required:
- Cost of Goods Sold (COGS) for the period being analyzed.
- Average inventory level during the same period.
- Sales data (optional for further insights).
- Inventory records broken down by product category (optional for more granular analysis).
Detailed step-by-step instruction on how to conduct the analysis:
1. Calculate the average inventory for the period.
Average Inventory = (Beginning Inventory + Ending Inventory) / 2
This gives a more accurate reflection of the inventory levels across the period rather than just using one data point.
2. Obtain Cost of Goods Sold (COGS).
COGS can be found on the company’s income statement. It represents the direct costs attributable to the production of the goods sold by the company.
3. Calculate the inventory turnover ratio.
Use the following formula to determine inventory turnover:
Inventory Turnover = COGS / Average Inventory
4. Determine the inventory turnover in days.
To understand how long it takes, on average, to sell the inventory, use this formula:
Days in Inventory = (365 / Inventory Turnover)
This calculates the average number of days that inventory remains unsold.
5. Analyze by category (optional).
If more detailed data is available, calculate the inventory turnover for different product categories. This helps identify fast-moving vs. slow-moving items, allowing for more precise management.
Potential complications that can arise with this analysis:
- Seasonality: Retail businesses often experience fluctuations in demand due to seasonal events, which can distort inventory turnover results if not adjusted properly.
- Stockouts: High inventory turnover might sometimes indicate stockouts, which result in missed sales opportunities. This can falsely signal good performance.
- Inconsistent inventory valuation: Using different methods to value inventory (e.g., FIFO, LIFO) can lead to discrepancies in the analysis, particularly in periods of price fluctuation.
Format of the output of analysis:
The output is typically presented as the inventory turnover ratio, as well as the number of days inventory is held before being sold. A more detailed report could include breakdowns by product category or region.
Example output:
- Inventory turnover: 4.5 times per year
- Days in inventory: 81 days
- Product category breakdown:
- Apparel: 3.8 times per year (96 days)
- Electronics: 6.2 times per year (59 days)
How to interpret results:
- High inventory turnover: Indicates efficient inventory management and strong sales. However, excessively high turnover could suggest understocking, leading to potential stockouts and missed sales.
- Low inventory turnover: Suggests poor inventory management, overstocking, or slow-moving products. This ties up capital in inventory and increases carrying costs.
- Days in inventory: Fewer days in inventory is typically better, as it indicates the company is quickly selling its stock. However, industry standards should be taken into account when interpreting this number.
Steps a company can take to improve on this measure:
- Optimize inventory levels: Use demand forecasting and just-in-time (JIT) strategies to ensure inventory levels align with expected sales, minimizing overstocking and understocking.
- Improve demand forecasting: Leverage historical sales data, market trends, and promotional calendars to better anticipate customer demand and avoid excessive inventory buildup.
- Enhance inventory management systems: Implement or upgrade inventory tracking systems to provide real-time visibility into stock levels and streamline reordering processes.
- Liquidate slow-moving inventory: Offer promotions, discounts, or bundling strategies to clear out slow-moving inventory and free up cash for higher-demand products.
- Focus on supply chain efficiency: Work with suppliers to reduce lead times and ensure more frequent, smaller deliveries. This reduces the need for large inventory reserves.
- Improve category management: Analyze inventory turnover by product category and adjust product assortments to focus on fast-moving items while minimizing low-performing stock.
Request the PDF Download of How to Analyze a Retail Company
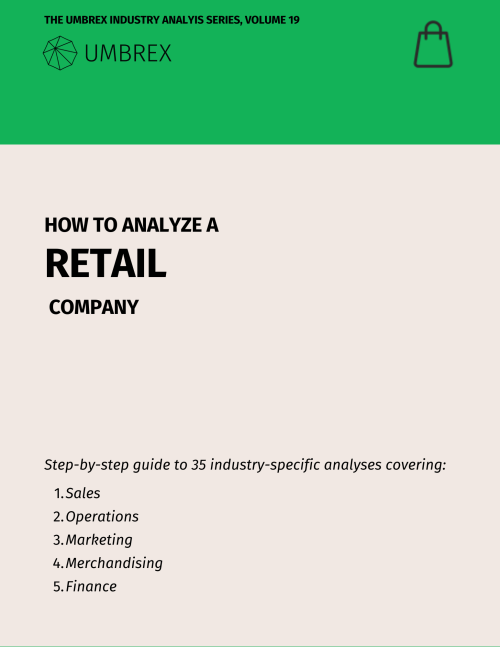
Menu of the 35 analyses:
Sales:
- Comparable Store Sales Analysis
- Cross-Selling and Up-Selling Effectiveness
- Customer Lifetime Value
- Customer Return Rate Analysis
- Foot Traffic and Conversion Rate Analysis
- Location-Based Performance Analysis
- Omnichannel Strategy Effectiveness
- Seasonality Impact and Sales Mix Analysis
- Store Atmosphere and Experience Impact on Sales
Operations:
- Click-and-Collect/Buy Online, Pickup In-Store (BOPIS) Effectiveness
- E-commerce Fulfillment Efficiency and Cost Analysis
- In-Stock Rate and Out-of-Stock Analysis
- Inventory Turnover and Management Analysis
- Shelf Space Allocation and Optimization
- Store Closure and Rationalization Analysis
- Store Expansion and Cannibalization Risk Analysis
- Store Labor Productivity Analysis
- Store Lease and Real Estate Cost Efficiency
- Sustainability and Ethical Sourcing in Retail
Marketing:
Merchandising:
- Markdown Strategy and Effectiveness
- Merchandising Strategy Effectiveness
- Planogram Compliance and Store Layout Efficiency, including Endcap Performance
- Private Label vs. Branded Product Performance and Supplier Dependency Strategy
- Product Category Margin Analysis
- Stock Keeping Unit (SKU) Rationalization and Retail Product Assortment Optimization
- Visual Merchandising Performance