
Goal of the analysis:
The goal of Consumer Sentiment and Brand Perception Analysis is to evaluate how customers feel about a retail brand, their overall satisfaction, and how positively or negatively they perceive the brand. This analysis helps retail companies gauge brand loyalty, understand public opinion, and identify areas for improvement to enhance customer relationships and long-term sales.
Data required:
- Customer surveys or feedback on brand perception.
- Social media sentiment data (positive, neutral, negative mentions).
- Net Promoter Score (NPS) or customer satisfaction (CSAT) score.
- Online reviews and ratings from platforms like Google, Yelp, or e-commerce sites.
- Brand-related keyword analysis (how often and in what context customers mention the brand).
- Customer complaint or support data (optional for understanding negative sentiment).
- Competitor sentiment and brand perception data (optional for benchmarking).
- Brand awareness metrics from marketing campaigns (optional for measuring reach).
Detailed step-by-step instruction on how to conduct the analysis:
1. Collect customer surveys and feedback data.
Conduct customer surveys using questions related to overall brand perception, product quality, customer service, and how likely they are to recommend the brand. Use a standardized scale (e.g., 1 to 5) to rate each category.
Example questions include:
- “How would you rate your satisfaction with our brand?”
- “How likely are you to recommend us to a friend?” (for NPS).
2. Calculate Net Promoter Score (NPS).
NPS measures customer loyalty and brand advocacy. Use this equation to calculate NPS:
NPS = % of Promoters (9-10 ratings) – % of Detractors (0-6 ratings)
This score provides a single number to track overall customer sentiment, with a higher score indicating stronger customer loyalty.
3. Monitor social media sentiment.
Use social listening tools to track how often customers mention your brand on social media and whether those mentions are positive, neutral, or negative.
Calculate the sentiment ratio:
Sentiment Ratio = (Number of Positive Mentions – Number of Negative Mentions) / Total Mentions
A positive ratio indicates a favorable brand perception, while a negative ratio signals issues.
4. Analyze online reviews and ratings.
Track reviews and star ratings from online platforms such as Google, Yelp, or your e-commerce site.
Calculate the average rating and track the distribution of positive (4-5 stars), neutral (3 stars), and negative (1-2 stars) reviews.
Average Rating = (Sum of All Review Scores) / (Total Number of Reviews)
High ratings suggest strong brand perception, while negative reviews highlight areas that need attention.
5. Conduct sentiment keyword analysis.
Identify key themes or topics in customer feedback, online reviews, or social media mentions. Use keyword analysis tools to track frequently mentioned words, grouping them into positive, neutral, or negative categories. This helps uncover specific areas of concern or positive aspects of your brand.
6. Benchmark brand perception against competitors (optional).
Gather data on competitor brands, including customer sentiment, reviews, and NPS scores, if available. Compare how your brand performs relative to competitors to identify where your brand stands in the market.
7. Monitor customer complaints or support data (optional).
Track the number of customer complaints or customer service interactions related to the brand. High levels of complaints may indicate issues with brand perception, particularly if common themes or recurring issues arise.
Potential complications that can arise with this analysis:
- Bias in customer surveys: Survey respondents may not represent the full customer base, potentially skewing the results toward particularly satisfied or dissatisfied customers.
- Sentiment variability: Customer sentiment can fluctuate due to temporary factors (e.g., product recalls, marketing campaigns) that may not reflect long-term brand perception.
- Incomplete data: Social media sentiment or online reviews may not capture the entire customer base, particularly for customers who don’t engage online.
- Competitor data availability: Benchmarking against competitors can be challenging if reliable sentiment or NPS data is not publicly available.
Format of the output of analysis:
The output typically includes key metrics such as NPS, customer satisfaction scores, sentiment ratio, and overall brand rating. These metrics can be presented in charts, sentiment dashboards, or detailed reports showing trends over time and compared against competitors.
Example output:
- Net Promoter Score (NPS): 45
- Customer Satisfaction (CSAT) Score: 4.5/5
- Sentiment Ratio: +0.7 (60% positive, 10% negative, 30% neutral)
- Average Review Rating: 4.3/5 (from 500 reviews)
- Common positive themes: Excellent customer service, high-quality products
- Common negative themes: Long delivery times, limited stock availability
How to interpret results:
- High NPS or CSAT: Indicates strong brand loyalty and satisfaction, suggesting that customers are likely to return and recommend the brand.
- Positive sentiment ratio: A high positive sentiment ratio indicates that customers view the brand favorably, while a negative ratio signals potential issues that need to be addressed.
- High average review rating: Consistently high ratings (e.g., 4+ stars) suggest that customers are happy with their experience, while a decline in average rating may indicate emerging problems.
- Negative themes or complaints: Recurring issues identified in reviews, customer feedback, or complaints point to specific areas that require immediate attention, such as product quality, shipping delays, or customer service.
Steps a company can take to improve on this measure:
- Enhance customer service: If negative sentiment stems from poor customer service, invest in staff training, improve response times, and offer personalized solutions to customer issues.
- Monitor and respond to online feedback: Actively respond to customer reviews and social media mentions, addressing both positive and negative feedback to show that the brand values customer opinions.
- Optimize product or service offerings: Use customer feedback to identify issues with product quality, stock availability, or pricing, and make adjustments to improve the overall customer experience.
- Increase positive brand engagement: Leverage marketing campaigns, social media engagement, and influencer partnerships to create more positive interactions with the brand and improve overall perception.
- Regularly conduct customer surveys: Collect ongoing feedback through customer satisfaction surveys, NPS questionnaires, or follow-up emails to stay informed about customer sentiment and track progress over time.
- Proactively address recurring issues: Identify the most common negative feedback themes and work cross-functionally to resolve them (e.g., faster shipping, better return policies, product improvements).
- Benchmark against competitors: Use competitor data to identify areas where your brand excels and where improvements are needed to stay competitive in terms of customer perception.
Request the PDF Download of How to Analyze a Retail Company
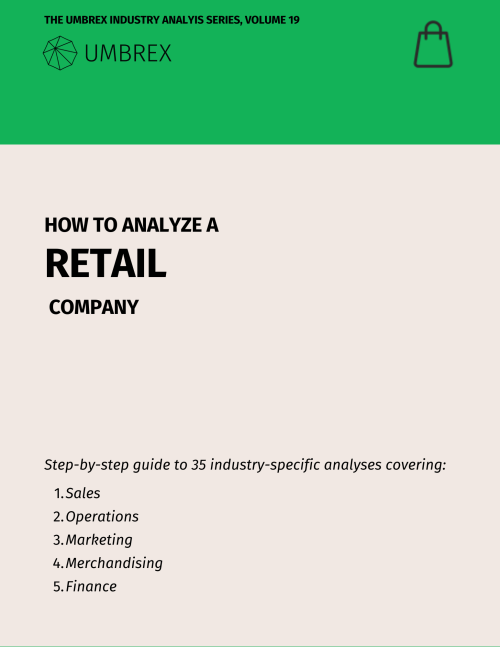
Menu of the 35 analyses:
Sales:
- Comparable Store Sales Analysis
- Cross-Selling and Up-Selling Effectiveness
- Customer Lifetime Value
- Customer Return Rate Analysis
- Foot Traffic and Conversion Rate Analysis
- Location-Based Performance Analysis
- Omnichannel Strategy Effectiveness
- Seasonality Impact and Sales Mix Analysis
- Store Atmosphere and Experience Impact on Sales
Operations:
- Click-and-Collect/Buy Online, Pickup In-Store (BOPIS) Effectiveness
- E-commerce Fulfillment Efficiency and Cost Analysis
- In-Stock Rate and Out-of-Stock Analysis
- Inventory Turnover and Management Analysis
- Shelf Space Allocation and Optimization
- Store Closure and Rationalization Analysis
- Store Expansion and Cannibalization Risk Analysis
- Store Labor Productivity Analysis
- Store Lease and Real Estate Cost Efficiency
- Sustainability and Ethical Sourcing in Retail
Marketing:
Merchandising:
- Markdown Strategy and Effectiveness
- Merchandising Strategy Effectiveness
- Planogram Compliance and Store Layout Efficiency, including Endcap Performance
- Private Label vs. Branded Product Performance and Supplier Dependency Strategy
- Product Category Margin Analysis
- Stock Keeping Unit (SKU) Rationalization and Retail Product Assortment Optimization
- Visual Merchandising Performance