
Goal of the analysis:
The goal of the In-Stock Rate and Out-of-Stock Analysis is to measure how effectively a retail company is managing its inventory to meet customer demand. The in-stock rate measures the percentage of products available for sale, while the out-of-stock rate highlights the percentage of products unavailable due to insufficient inventory. This analysis helps retailers identify inventory management issues and improve product availability.
Data required:
- Total number of SKUs (Stock Keeping Units) or product categories offered.
- Number of SKUs that are in-stock during a specific time period.
- Number of SKUs that are out-of-stock during the same period.
- Sales data for each SKU or category (optional for further insights).
- Historical demand or sales forecasts (optional for better demand matching).
Detailed step-by-step instruction on how to conduct the analysis:
1. Collect inventory data.
Record the total number of SKUs offered and the number of SKUs that are in stock during a specific time period. Ensure this data is collected from the same time frame (e.g., daily, weekly, monthly) across all stores or locations being analyzed.
2. Calculate the in-stock rate.
Use the following formula to calculate the in-stock rate:
In-Stock Rate (%) = (Number of In-Stock SKUs / Total Number of SKUs) x 100
This tells you what percentage of products are available for customers at any given time.
3. Calculate the out-of-stock rate.
Use this formula to calculate the out-of-stock rate:
Out-of-Stock Rate (%) = (Number of Out-of-Stock SKUs / Total Number of SKUs) x 100
Alternatively, you can subtract the in-stock rate from 100 to find the out-of-stock rate:
Out-of-Stock Rate (%) = 100 – In-Stock Rate (%)
4. Segment analysis by store or product category (optional).
If more granular data is available, conduct the in-stock and out-of-stock analysis by store location, product category, or region. This helps in identifying areas with higher or lower product availability.
5. Analyze trends over time.
Track the in-stock and out-of-stock rates over time to identify patterns, such as frequent stockouts during peak demand periods or seasonal fluctuations.
6. Compare against sales data (optional).
If sales data is available, compare the out-of-stock rates to missed sales opportunities. Products with high sales volume but frequent stockouts can highlight significant lost revenue potential.
Potential complications that can arise with this analysis:
- Inaccurate inventory records: Poor record-keeping or delays in updating inventory data can skew the analysis, leading to inaccurate in-stock or out-of-stock rates.
- Unaccounted for promotions: Products may go out-of-stock faster during promotions or sales events, making it difficult to assess normal stocking levels.
- Partial stockouts: If only some sizes or variants of a product are out-of-stock, this can distort the true impact of stockouts on sales and customer satisfaction.
Format of the output of analysis:
The output of this analysis typically includes in-stock and out-of-stock percentages. A more detailed report might include a breakdown by store, product category, or SKU, as well as trends over time.
Example output:
- In-stock rate for Q3 2024: 92%
- Out-of-stock rate for Q3 2024: 8%
- Breakdown by category:
- Electronics: 90% in-stock
- Apparel: 95% in-stock
- Home Goods: 87% in-stock
- Out-of-stock analysis by region:
- Northeast: 10% out-of-stock
- West Coast: 6% out-of-stock
How to interpret results:
- High in-stock rate (95% or above): Indicates good inventory management, meaning most products are available to meet customer demand.
- Low in-stock rate (below 90%): Suggests issues with inventory replenishment, demand forecasting, or supply chain inefficiencies. This can lead to missed sales opportunities and customer dissatisfaction.
- High out-of-stock rate: A high out-of-stock rate points to potential problems in procurement, demand forecasting, or inventory allocation. This could lead to lost sales and harm customer loyalty.
- Product category insights: If certain product categories have consistently lower in-stock rates, this could indicate problems with suppliers or inaccurate demand forecasting for those categories.
Steps a company can take to improve on this measure:
- Improve demand forecasting: Use historical sales data and market trends to better predict customer demand and prevent stockouts of high-demand products.
- Optimize inventory replenishment: Implement just-in-time (JIT) inventory management or automated replenishment systems to ensure stock levels are adjusted frequently based on real-time demand.
- Enhance supplier relationships: Work closely with suppliers to reduce lead times and improve stock availability, particularly for high-demand or fast-moving products.
- Segment stock allocation by store: Allocate stock more strategically based on regional demand, ensuring high-demand items are always available in the right locations.
- Leverage safety stock: Keep buffer stock (safety stock) for products with volatile demand or longer lead times to avoid stockouts during peak periods.
- Implement inventory tracking technology: Use RFID, barcode scanning, or real-time inventory systems to monitor stock levels and avoid discrepancies that lead to stockouts.
- Run promotions cautiously: Plan inventory levels accordingly when running promotions or sales events to avoid unanticipated stockouts and lost revenue.
Request the PDF Download of How to Analyze a Retail Company
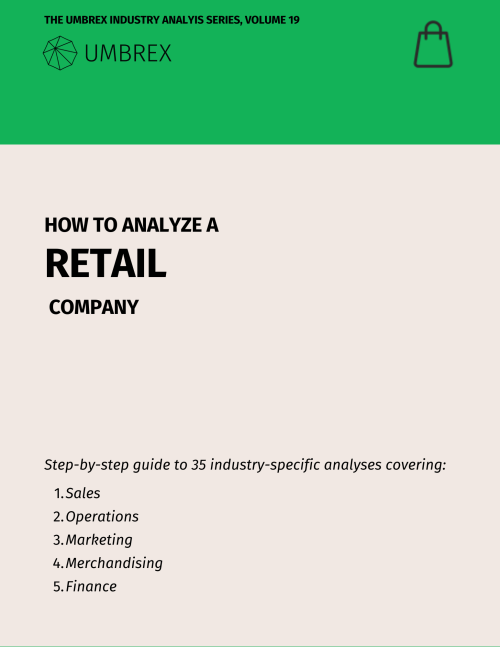
Menu of the 35 analyses:
Sales:
- Comparable Store Sales Analysis
- Cross-Selling and Up-Selling Effectiveness
- Customer Lifetime Value
- Customer Return Rate Analysis
- Foot Traffic and Conversion Rate Analysis
- Location-Based Performance Analysis
- Omnichannel Strategy Effectiveness
- Seasonality Impact and Sales Mix Analysis
- Store Atmosphere and Experience Impact on Sales
Operations:
- Click-and-Collect/Buy Online, Pickup In-Store (BOPIS) Effectiveness
- E-commerce Fulfillment Efficiency and Cost Analysis
- In-Stock Rate and Out-of-Stock Analysis
- Inventory Turnover and Management Analysis
- Shelf Space Allocation and Optimization
- Store Closure and Rationalization Analysis
- Store Expansion and Cannibalization Risk Analysis
- Store Labor Productivity Analysis
- Store Lease and Real Estate Cost Efficiency
- Sustainability and Ethical Sourcing in Retail
Marketing:
Merchandising:
- Markdown Strategy and Effectiveness
- Merchandising Strategy Effectiveness
- Planogram Compliance and Store Layout Efficiency, including Endcap Performance
- Private Label vs. Branded Product Performance and Supplier Dependency Strategy
- Product Category Margin Analysis
- Stock Keeping Unit (SKU) Rationalization and Retail Product Assortment Optimization
- Visual Merchandising Performance