
Goal of the analysis:
The goal of Comparable Store Sales (Same-Store Sales) Analysis is to evaluate the performance of retail locations that have been open for at least one year. This analysis removes the impact of new store openings and closures, providing a clearer picture of organic sales growth or decline from existing stores.
Data required:
- Sales data for each store, segmented by time period (daily, weekly, monthly, or quarterly).
- List of stores that have been open for at least one year.
- Historical sales data for the same stores during the same period in the previous year.
- External factors that might affect sales, such as promotions, seasonal events, or macroeconomic trends.
Detailed step-by-step instruction on how to conduct the analysis:
1. Identify eligible stores.
Start by selecting stores that have been open for at least 12 months. Exclude any stores that opened or closed during the analysis period.
2. Collect current period sales data.
Gather the sales data for each eligible store during the current period (e.g., this month, quarter, or year).
3. Collect prior period sales data.
Collect the sales data for the same period in the prior year for each eligible store.
4. Calculate same-store sales growth for each store.
Use the following equation to calculate growth for each store:
Same-Store Sales Growth (%) = ((Current Period Sales – Prior Period Sales) / Prior Period Sales) x 100
5. Aggregate results.
Sum the sales from all eligible stores for both the current period and the prior period to get the total sales for each time frame.
6. Calculate overall same-store sales growth.
Use the aggregated sales to calculate the overall growth:
Total Same-Store Sales Growth (%) = ((Total Current Period Sales – Total Prior Period Sales) / Total Prior Period Sales) x 100
7. Adjust for external factors if necessary.
In some cases, you may need to adjust for promotions, store renovations, or regional economic factors that might skew the results.
Potential complications that can arise with this analysis:
- Promotions or discounts: Significant promotional activities can distort same-store sales by inflating sales numbers temporarily.
- Store renovations: If a store underwent renovations during the period, this might reduce foot traffic and sales, skewing the analysis.
- Unusual events: Events such as economic downturns, natural disasters, or local disruptions (e.g., road closures) can impact store performance and make comparisons less reliable.
- Shifts to online shopping: A significant shift of customers from in-store to online shopping can affect same-store sales, particularly in omnichannel retail.
Format of the output of analysis:
The output is usually presented as a percentage indicating the growth or decline in same-store sales. You can also create a detailed report by store, region, or product category for more granular insights.
Example output:
- Same-store sales growth for Q2 2024: +2.7%
- Same-store sales growth by region:
- West Coast: +1.9%
- Midwest: +3.2%
- Same-store sales growth by product category:
- Electronics: +4.1%
- Apparel: +1.0%
How to interpret results:
- Positive growth: A positive percentage indicates that existing stores are growing, which could be due to factors like higher foot traffic, larger transaction sizes, or successful promotions.
- Negative growth: A negative percentage points to a decline in store performance, which could be caused by declining customer interest, increased competition, or inefficiencies in operations.
- Flat or negligible growth: Little to no growth could suggest that while the company is stable, it is not expanding its customer base or increasing sales efficiency.
Steps a company can take to improve on this measure:
- Enhance customer engagement: Improve in-store experiences, customer service, and atmosphere to attract repeat customers.
- Optimize inventory management: Ensure popular products are in stock and available. Poor inventory management can lead to lost sales and lower same-store performance.
- Refine promotional strategies: Offer targeted promotions that increase foot traffic and drive larger purchases without heavily discounting margins.
- Implement omnichannel strategies: Encourage customers to use both online and in-store shopping options (e.g., Buy Online, Pickup In-Store).
- Improve store layout: Analyze customer flow and layout efficiency to encourage longer browsing times and increased sales per visit.
- Training staff: Ensure employees are trained to upsell and cross-sell, maximizing the potential sales from each customer visit.
Request the PDF Download of How to Analyze a Retail Company
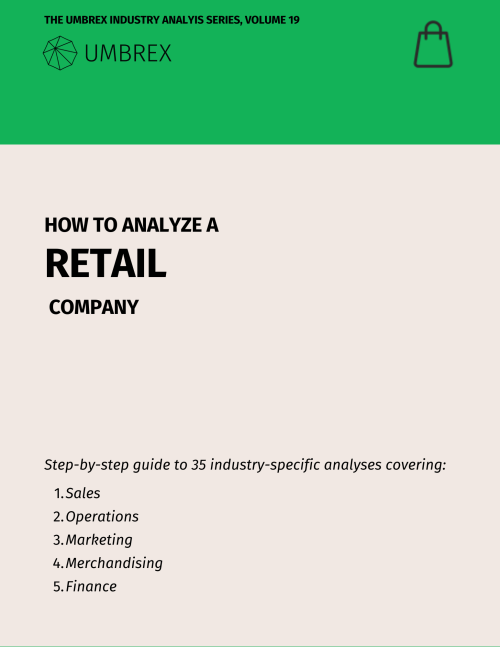
Menu of the 35 analyses:
Sales:
- Comparable Store Sales Analysis
- Cross-Selling and Up-Selling Effectiveness
- Customer Lifetime Value
- Customer Return Rate Analysis
- Foot Traffic and Conversion Rate Analysis
- Location-Based Performance Analysis
- Omnichannel Strategy Effectiveness
- Seasonality Impact and Sales Mix Analysis
- Store Atmosphere and Experience Impact on Sales
Operations:
- Click-and-Collect/Buy Online, Pickup In-Store (BOPIS) Effectiveness
- E-commerce Fulfillment Efficiency and Cost Analysis
- In-Stock Rate and Out-of-Stock Analysis
- Inventory Turnover and Management Analysis
- Shelf Space Allocation and Optimization
- Store Closure and Rationalization Analysis
- Store Expansion and Cannibalization Risk Analysis
- Store Labor Productivity Analysis
- Store Lease and Real Estate Cost Efficiency
- Sustainability and Ethical Sourcing in Retail
Marketing:
Merchandising:
- Markdown Strategy and Effectiveness
- Merchandising Strategy Effectiveness
- Planogram Compliance and Store Layout Efficiency, including Endcap Performance
- Private Label vs. Branded Product Performance and Supplier Dependency Strategy
- Product Category Margin Analysis
- Stock Keeping Unit (SKU) Rationalization and Retail Product Assortment Optimization
- Visual Merchandising Performance