
Goal of the analysis:
The goal of Product Category Margin Analysis is to assess the profitability of different product categories within a retail business. This analysis helps retailers understand which categories are driving profit and which may need attention in terms of pricing, promotion, or assortment management.
Data required:
- Sales revenue by product category.
- Cost of Goods Sold (COGS) by product category.
- Discounts or promotional expenses (optional for more granular analysis).
- Overhead or operational costs allocated to each category (optional for a more detailed view of true profitability).
Detailed step-by-step instruction on how to conduct the analysis:
1. Collect sales and COGS data.
Gather the total sales revenue and COGS for each product category during the period under review.
Ensure data is accurate and categorized appropriately.
2. Calculate the gross margin for each product category.
Use the following equation to determine the gross margin for each category:
Gross Margin = (Sales – COGS)
This gives you the absolute margin in dollars for each category.
3. Calculate gross margin percentage.
To express the margin as a percentage, use this formula:
Gross Margin (%) = ((Sales – COGS) / Sales) x 100
This provides insight into how much profit is made as a percentage of sales for each product category.
4. Adjust for promotional expenses (optional).
If discounts or promotional costs significantly impact certain categories, subtract these from the gross margin to get a more accurate picture of net profitability.
5. Allocate overhead costs (optional).
If possible, allocate operating costs (e.g., store labor, marketing expenses) to each category to understand the true profitability beyond the gross margin.
6. Compare across categories.
Once margins are calculated, compare them across categories to identify which ones are performing well and which are underperforming.
Potential complications that can arise with this analysis:
- Inconsistent cost allocation: Allocating overhead costs to product categories can be difficult and inconsistent, potentially skewing results.
- Promotions and discounts: Heavy discounting in a category may lead to misleading margin figures if promotional expenses are not accounted for.
- Data accuracy: Inaccurate categorization of sales and COGS data may result in incorrect margin calculations, leading to poor decision-making.
Format of the output of analysis:
The output is typically presented as both gross margin (in dollars) and gross margin percentage by product category. A more detailed report may include adjustments for promotional expenses or allocated overhead costs.
Example output:
- Gross margin by product category:
- Apparel: $50,000 (25%)
- Electronics: $75,000 (30%)
- Home Goods: $30,000 (15%)
- Beauty Products: $45,000 (35%)
How to interpret results:
- High margin categories: Categories with higher gross margins are contributing more to overall profitability. These categories may be candidates for further investment in promotion or inventory expansion.
- Low margin categories: Categories with lower margins may indicate issues such as high COGS, excessive discounting, or inefficiencies in sourcing. These categories may need price adjustments, vendor renegotiations, or promotional strategy revisions.
- Category comparison: Comparing margins across categories helps in understanding where the business is most profitable and where resources may need to be reallocated.
Steps a company can take to improve on this measure:
- Negotiate better vendor terms: Work with suppliers to reduce COGS in categories with lower margins, either by improving purchase terms or securing volume discounts.
- Optimize pricing strategy: Review pricing strategies for underperforming categories and consider increasing prices where demand elasticity allows, or implementing more dynamic pricing models.
- Reduce promotional dependency: Limit deep discounting or frequent promotions in categories with already slim margins to protect profitability.
- Improve inventory management: Streamline inventory in low-margin categories to focus on higher-margin products, minimizing stock levels of less profitable items.
- Reevaluate product assortment: Consider discontinuing low-margin products in favor of higher-margin alternatives or exploring new product lines that align with customer demand while offering better profitability.
- Focus on upselling and cross-selling: Train staff and implement marketing strategies that encourage customers to purchase more from higher-margin categories.
Request the PDF Download of How to Analyze a Retail Company
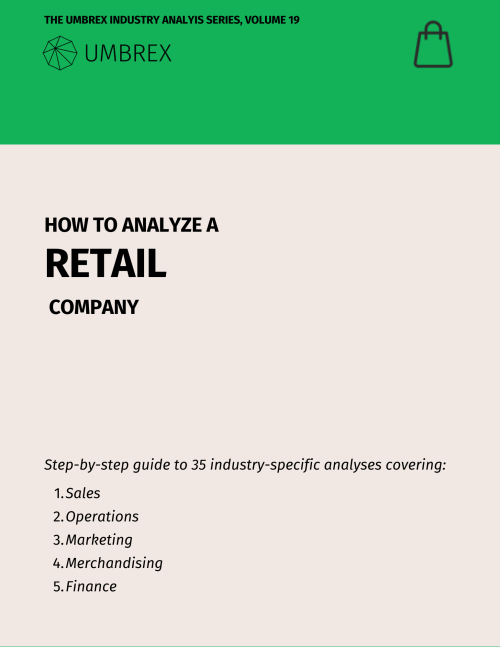
Menu of the 35 analyses:
Sales:
- Comparable Store Sales Analysis
- Cross-Selling and Up-Selling Effectiveness
- Customer Lifetime Value
- Customer Return Rate Analysis
- Foot Traffic and Conversion Rate Analysis
- Location-Based Performance Analysis
- Omnichannel Strategy Effectiveness
- Seasonality Impact and Sales Mix Analysis
- Store Atmosphere and Experience Impact on Sales
Operations:
- Click-and-Collect/Buy Online, Pickup In-Store (BOPIS) Effectiveness
- E-commerce Fulfillment Efficiency and Cost Analysis
- In-Stock Rate and Out-of-Stock Analysis
- Inventory Turnover and Management Analysis
- Shelf Space Allocation and Optimization
- Store Closure and Rationalization Analysis
- Store Expansion and Cannibalization Risk Analysis
- Store Labor Productivity Analysis
- Store Lease and Real Estate Cost Efficiency
- Sustainability and Ethical Sourcing in Retail
Marketing:
Merchandising:
- Markdown Strategy and Effectiveness
- Merchandising Strategy Effectiveness
- Planogram Compliance and Store Layout Efficiency, including Endcap Performance
- Private Label vs. Branded Product Performance and Supplier Dependency Strategy
- Product Category Margin Analysis
- Stock Keeping Unit (SKU) Rationalization and Retail Product Assortment Optimization
- Visual Merchandising Performance