
Goal of the analysis:
The goal of the Retail Pricing and Discount Strategy Analysis is to evaluate how effectively a retail company sets prices and offers discounts to maximize revenue, maintain profitability, and attract customers. This analysis helps determine whether pricing and discount strategies are aligned with business goals, customer demand, and market conditions.
Data required:
- Historical pricing data for products (regular price and discounted price).
- Sales data, segmented by product, category, and time period.
- Competitor pricing data (optional for benchmarking).
- Customer demand elasticity or response to price changes.
- Discount data (frequency, duration, and amount of discounts applied).
- Profit margins for each product and category.
- Inventory data (to assess the impact of pricing on stock levels).
Detailed step-by-step instruction on how to conduct the analysis:
1. Collect historical pricing and sales data.
Start by gathering data on the original price, discounted price (if applicable), and units sold for each product or category during a specific period. Ensure the data is aligned by time frame (e.g., daily, weekly, monthly).
2. Analyze sales performance based on pricing.
Compare sales volumes before and after discounts are applied. Use the following equation to calculate the price elasticity of demand:
Price Elasticity of Demand = (Percentage Change in Quantity Sold / Percentage Change in Price)
This will help assess how sensitive customer demand is to price changes.
3. Calculate profit margins.
For each product or category, calculate the gross profit margin at both regular price and discounted price:
Gross Profit Margin (%) = ((Sales Price – Cost of Goods Sold) / Sales Price) x 100
Analyze how discounts impact overall profitability.
4. Evaluate discount effectiveness.
Assess how often and for how long discounts are applied and how they affect total revenue and profit. This can be done by segmenting sales data by product category or promotion period.
For example:
Discount Impact on Revenue (%) = ((Revenue During Discount – Revenue Without Discount) / Revenue Without Discount) x 100
5. Benchmark against competitors (optional).
If competitor pricing data is available, compare the company’s pricing and discounting strategies to industry peers. This helps identify whether the company is priced too high or low relative to competitors and whether discounts are competitive.
6. Segment pricing analysis by customer demographics.
If customer data is available, evaluate how different customer segments respond to pricing and discounting strategies. This can help tailor future pricing models for specific customer groups.
7. Assess stock clearance vs. revenue impact.
For heavily discounted products, assess whether the discounting strategy is moving slow-moving stock efficiently or simply eroding margins without clear inventory management benefits.
Potential complications that can arise with this analysis:
- Inconsistent data collection: Incomplete or incorrect data on discounts, sales, or customer response can lead to inaccurate conclusions.
- Promotional overlap: Multiple promotions running simultaneously can make it difficult to isolate the impact of each discount or price reduction.
- Customer behavior variability: Customer responses to discounts may vary by season, region, or market conditions, complicating the analysis.
- Competitor influence: Competitor actions, such as sudden price cuts or new product launches, can affect the outcome of pricing strategies.
Format of the output of analysis:
The output typically includes metrics such as average price reductions, the impact of discounts on sales volume, and profitability analysis. Reports may be broken down by product category, time period, or customer segment.
Example output:
- Average price discount: 15%
- Sales volume increase after discount: +20%
- Gross profit margin before discount: 40%
- Gross profit margin after discount: 35%
- Revenue impact of discount for Product Category A: +12%
How to interpret results:
- Positive demand response to discounts: A high price elasticity (greater than 1) indicates that customers are highly responsive to price changes. This suggests that discounting is effective in increasing sales volume.
- Decreased profitability: If gross profit margins decrease significantly after discounts, it may indicate that the discounts are too steep and negatively affecting profitability.
- Poor sales despite discounts: If sales volume remains low even with discounts, it suggests that the product may be mispriced or that there is insufficient demand.
- Competitor comparison: If the company’s prices are higher than competitors and sales are lagging, it could indicate the need for price adjustments or more competitive promotions.
Steps a company can take to improve on this measure:
- Optimize discount timing: Offer discounts during periods of low demand to boost sales or to clear out seasonal inventory. Avoid deep discounts during peak sales periods unless necessary.
- Use dynamic pricing models: Implement pricing strategies that adjust in real time based on demand, seasonality, and competitive pricing to maximize both revenue and profitability.
- Tailor discounts to customer segments: Use customer data to offer personalized discounts based on purchase history or preferences. This can improve customer loyalty and increase sales without unnecessary broad discounts.
- Experiment with smaller price reductions: Test smaller, more frequent discounts to see if they can achieve similar sales boosts without eroding margins.
- Implement data-driven pricing strategies: Use data analytics to forecast customer demand and set prices accordingly, optimizing the balance between competitive pricing and profitability.
- Monitor competitor pricing more frequently: Keep a close eye on competitors’ pricing strategies to ensure your prices and discounts remain competitive in the market.
- Reduce dependency on blanket discounts: Focus on value-added promotions, such as bundled offers, free shipping, or loyalty program rewards, which may not require lowering prices while still increasing perceived value.
Request the PDF Download of How to Analyze a Retail Company
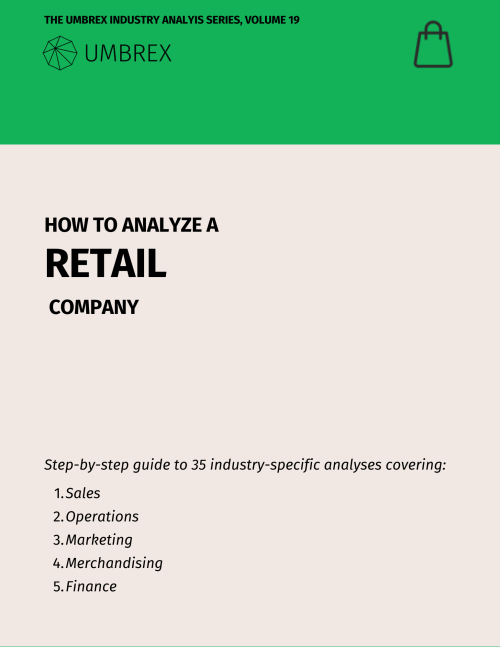
Menu of the 35 analyses:
Sales:
- Comparable Store Sales Analysis
- Cross-Selling and Up-Selling Effectiveness
- Customer Lifetime Value
- Customer Return Rate Analysis
- Foot Traffic and Conversion Rate Analysis
- Location-Based Performance Analysis
- Omnichannel Strategy Effectiveness
- Seasonality Impact and Sales Mix Analysis
- Store Atmosphere and Experience Impact on Sales
Operations:
- Click-and-Collect/Buy Online, Pickup In-Store (BOPIS) Effectiveness
- E-commerce Fulfillment Efficiency and Cost Analysis
- In-Stock Rate and Out-of-Stock Analysis
- Inventory Turnover and Management Analysis
- Shelf Space Allocation and Optimization
- Store Closure and Rationalization Analysis
- Store Expansion and Cannibalization Risk Analysis
- Store Labor Productivity Analysis
- Store Lease and Real Estate Cost Efficiency
- Sustainability and Ethical Sourcing in Retail
Marketing:
Merchandising:
- Markdown Strategy and Effectiveness
- Merchandising Strategy Effectiveness
- Planogram Compliance and Store Layout Efficiency, including Endcap Performance
- Private Label vs. Branded Product Performance and Supplier Dependency Strategy
- Product Category Margin Analysis
- Stock Keeping Unit (SKU) Rationalization and Retail Product Assortment Optimization
- Visual Merchandising Performance