

1. What Is the Leading vs Lagging Indicators Framework?
The Leading vs Lagging Indicators Framework is a measurement and management tool that distinguishes between metrics that predict future outcomes (leading indicators) and metrics that record outcomes after they occur (lagging indicators). In marketing, it helps teams monitor the right signals early, so they can adjust campaigns and investments in time to influence end results such as revenue, market share, or customer lifetime value.
This is a measurement, analytics, and performance management framework. It is commonly used by consultants and executives to link day-to-day marketing activity to strategic goals, align teams around the few metrics that matter, and run performance dialogues that drive timely, evidence-based decisions.
In simple terms: lagging indicators tell you whether you ultimately succeeded (e.g., revenue, profit, market share), while leading indicators tell you whether you are on track to succeed (e.g., brand search volume, site traffic quality, qualified pipeline, repeat purchase intent). The power of the framework is in making those causal links explicit, quantifying the time lag between them, and managing to the leading indicators without losing sight of the lagging outcomes.
2. Origin and Background
- Origin: Diffuse and longstanding. The concept of “leading” versus “lagging” indicators has been used in economics and management control for decades; precise origin is unknown.
- Popularization: The idea was widely popularized in management practice by Robert S. Kaplan and David P. Norton through the Balanced Scorecard in the early 1990s, which encouraged organizations to pair lagging outcomes with the process and capability metrics that drive them.
- Purpose: The framework was designed to solve a common management problem: by the time lagging results show up (e.g., quarterly revenue), it is often too late to course-correct. Leading indicators allow earlier detection and intervention.
- Diffusion: It became well known via business schools, consulting practices, and corporate performance management systems, and is now a staple in marketing operations, growth teams, and commercial excellence programs.
3. How the Leading vs Lagging Indicators Framework Works
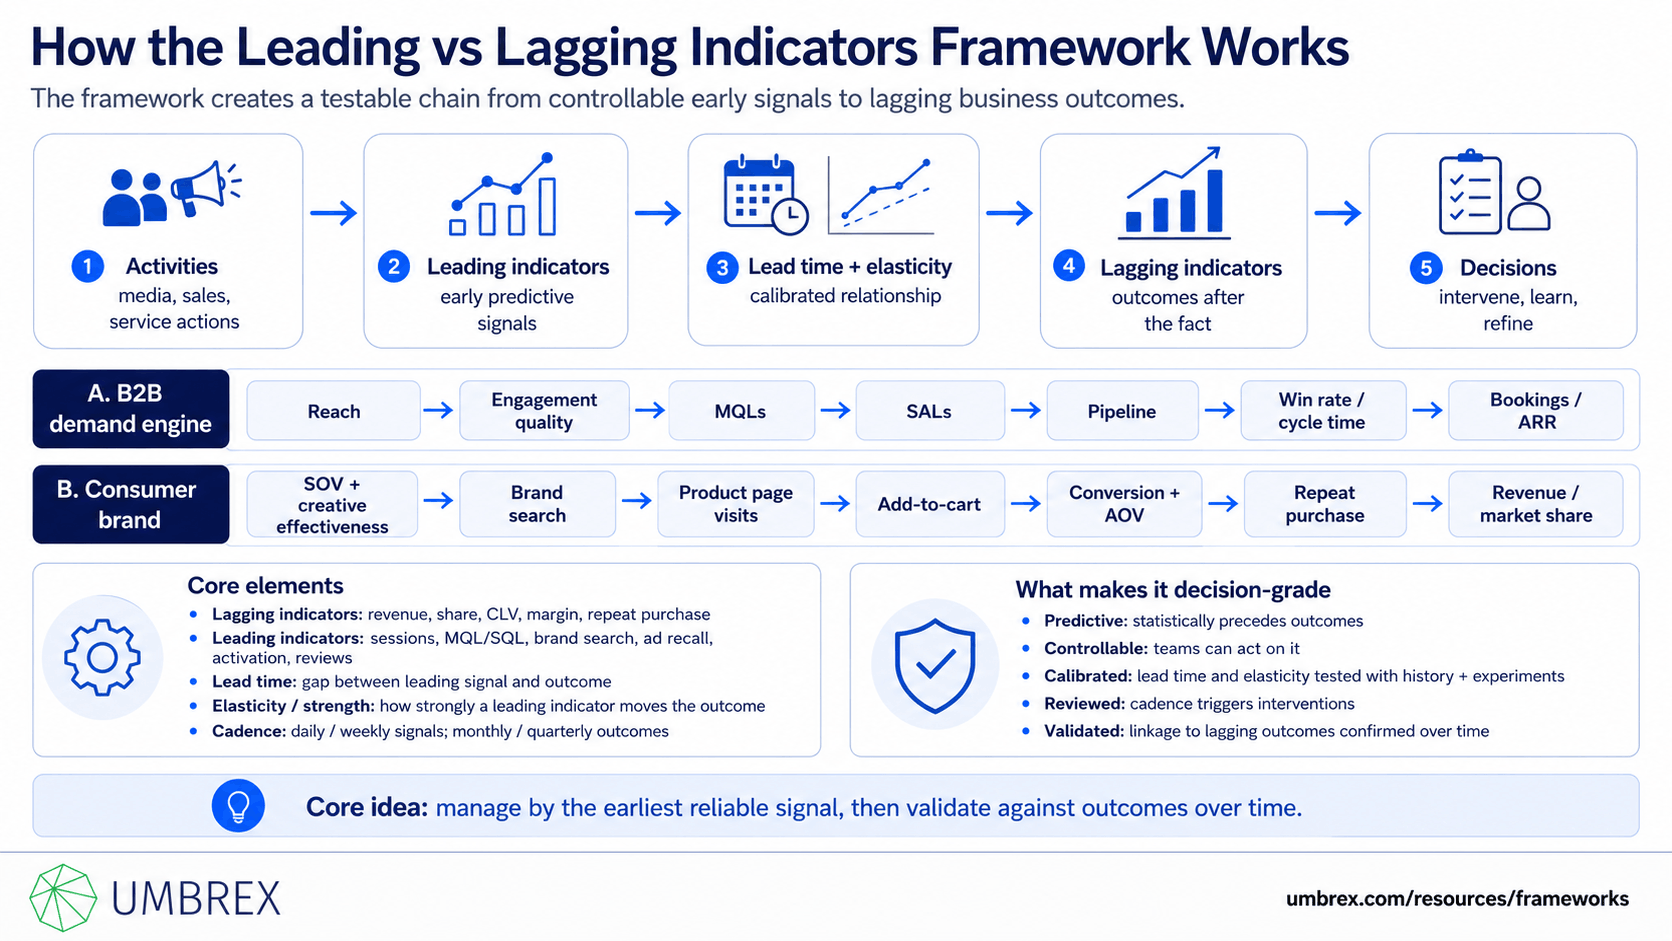
At its core, the framework creates an explicit, testable chain from activities to outcomes. You define the ultimate outcomes you care about (lagging), then identify earlier, more controllable signals that statistically and operationally precede those outcomes (leading). You monitor the leading signals frequently and manage interventions accordingly, while validating the linkage to lagging outcomes over time.
Core elements
- Lagging indicators (outcomes): Metrics that capture end results after the fact. In marketing: revenue, market share, customer acquisition cost (CAC) payback, customer lifetime value (CLV), gross margin, brand equity scores, repeat purchase rate.
- Leading indicators (drivers): Metrics that change earlier in the cycle and have predictive power for lagging outcomes. Examples: qualified web sessions, product detail page views, conversion rate to MQL/SQL, sales pipeline creation, brand search volume, share of voice, email click-through rate, ad recall, on-time SLA adherence in lead follow-up, trial activation rate, time-to-first-value, positive review velocity.
- Lead time: The typical time gap between a leading indicator moving and the corresponding effect showing up in a lagging outcome. Lead times vary by channel and business model—paid search conversions may materialize within days; brand advertising effects on market share may take quarters.
- Elasticity/strength of relationship: How strongly a change in a leading indicator translates into the lagging outcome. For example, a 10% increase in qualified pipeline may translate to a 6–8% increase in bookings depending on win rate and cycle time.
- Controllability and cadence: Good leading indicators are influenceable by the team and measurable at a cadence that supports timely action (often daily or weekly).
Building the “indicator chain”
A practical way to operationalize the framework is to construct an indicator tree or chain from activities to outcomes. For a B2B demand engine, it might look like:
- Top-of-funnel reach → Engagement quality → Marketing Qualified Leads (MQLs) → Sales Accepted Leads (SALs) → Pipeline created → Win rate and cycle time → Bookings → Revenue/ARR.
For a consumer brand, it could be:
- Share of voice and creative effectiveness → Brand search volume → Product page visits → Add-to-cart rate → Conversion rate → Average order value → Repeat purchase rate → Revenue and market share.
The framework is not theoretical: you test and calibrate these links using historical data, experiments, and operational reviews, then manage the business by the earliest reliable signals.
4. When to Use the Leading vs Lagging Indicators Framework
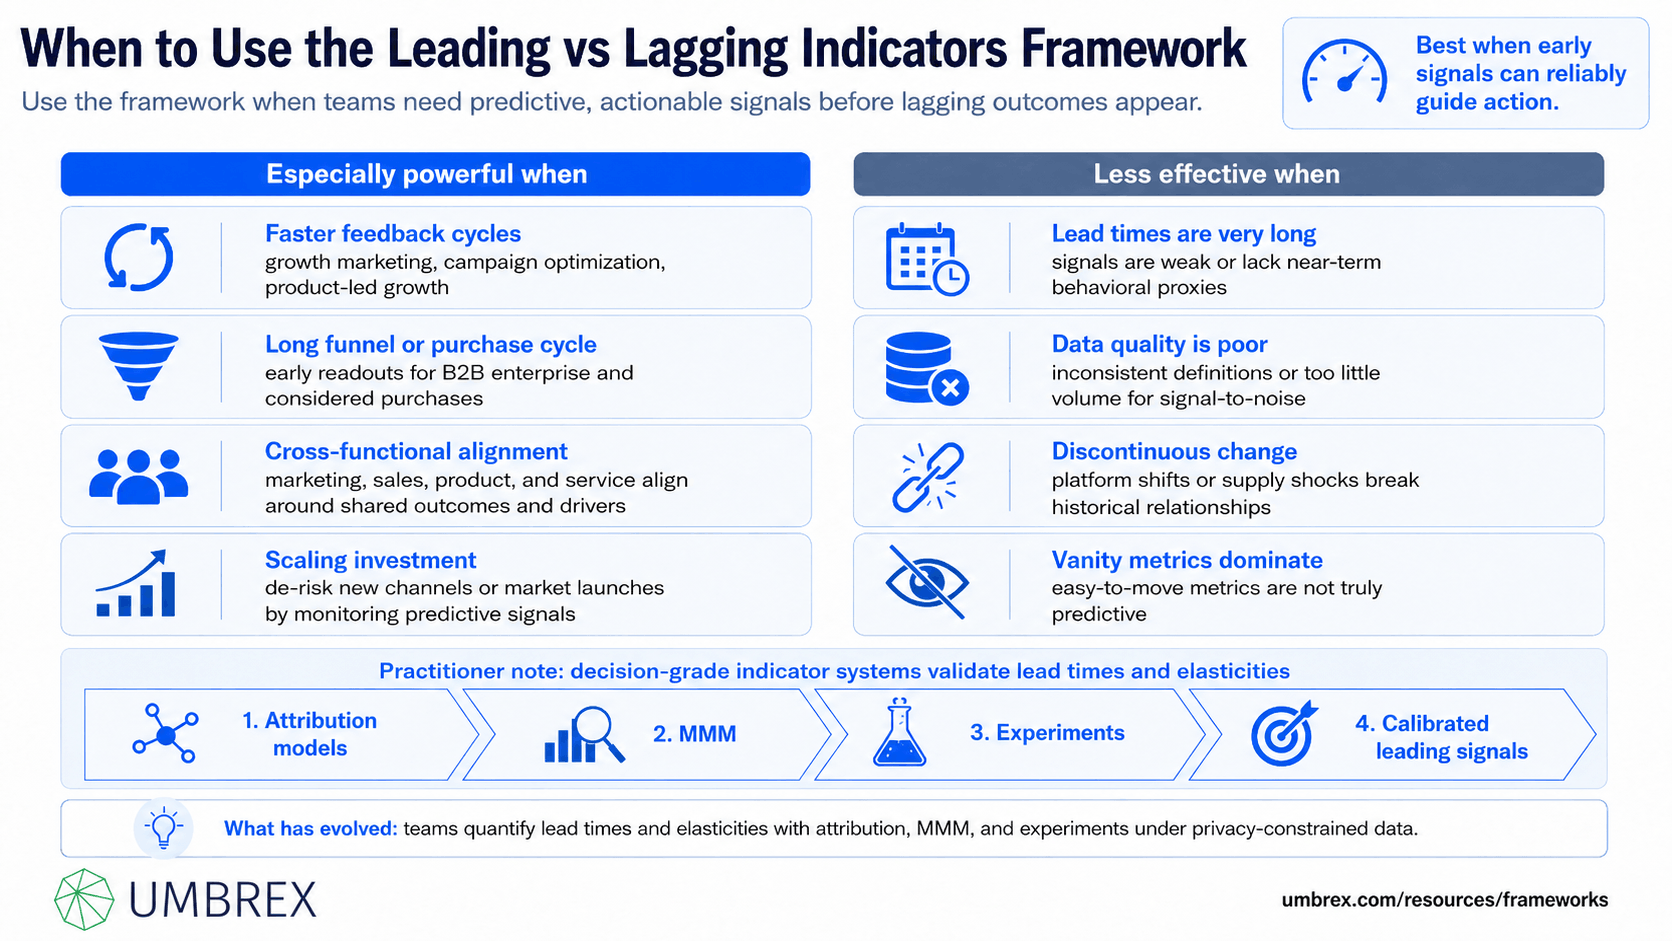
This framework is broadly useful across marketing contexts, but particularly powerful when:
- You need faster feedback cycles than quarterly revenue allows (e.g., growth marketing, campaign optimization, product-led growth).
- There’s a long funnel or purchase cycle (e.g., B2B enterprise sales, considered consumer purchases) and you need early readouts on whether activities are working.
- You’re aligning cross-functional teams (marketing, sales, product, service) around shared outcomes and actionable drivers.
- You are scaling investment and want to de-risk spend by monitoring predictive signals (e.g., scaling a new channel, launching in a new market).
It is less effective when:
- Lead times are extremely long and signals are weak (e.g., early brand work with no near-term behavioral proxies).
- Data quality is poor, definitions are inconsistent, or volumes are too small for meaningful signal-to-noise.
- The environment is undergoing discontinuous change (e.g., platform algorithm shifts, supply shocks) that break historical relationships.
- Teams over-index on “vanity” metrics that are easy to move but not truly predictive (e.g., raw impressions without measuring qualified reach or recall).
Practitioner note: The framework remains highly relevant. What has evolved is how teams quantify lead times and elasticities—today, organizations often combine the framework with attribution models, marketing mix modeling, and experimentation to validate causality under modern, privacy-constrained data conditions.
5. How to Apply the Framework: Step-by-Step
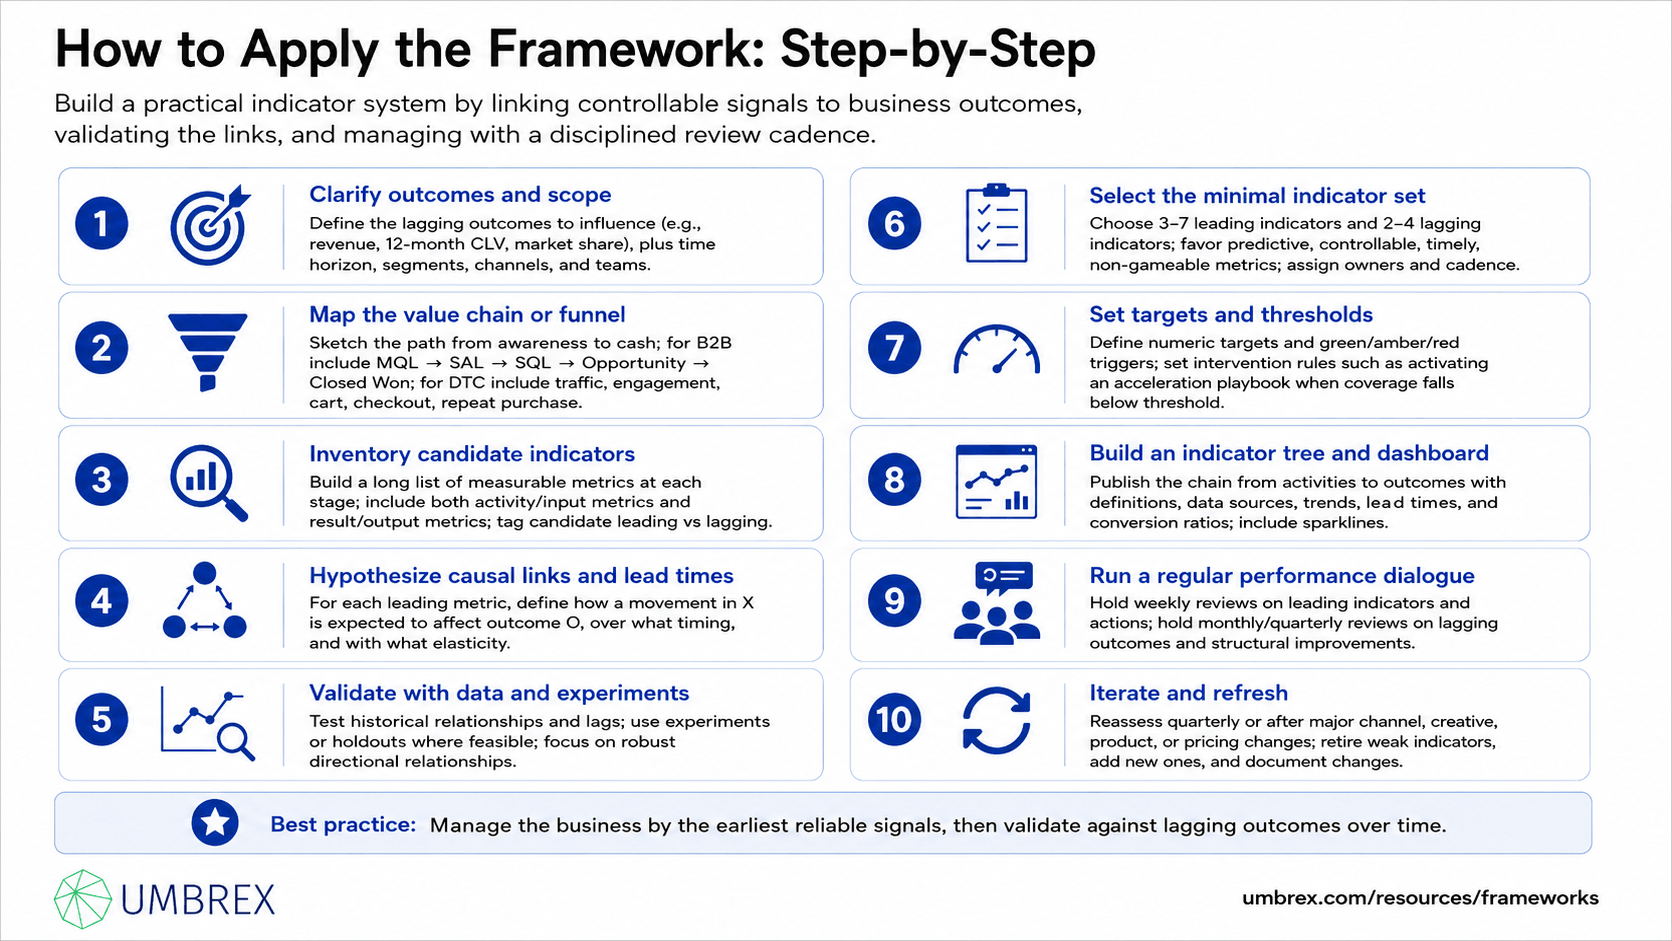
- Clarify the outcomes and scope.
Define the specific lagging outcomes you aim to influence (e.g., quarterly revenue in North America for Product X; 12-month CLV for new cohorts; market share in Category Y). Specify time horizon and the relevant segments, channels, and teams. Without clear outcomes, “leading” indicators have no anchor.
- Map your value chain or funnel.
Sketch the end-to-end path from audience exposure to cash: awareness → consideration → conversion → retention/expansion. For B2B, detail MQL → SAL → SQL → Opportunity → Closed Won, including handoffs and SLAs. For DTC, outline traffic sources, product page engagement, cart behavior, checkout, and repeat purchase triggers.
- Inventory candidate indicators.
Create a long list of measurable metrics at each stage. Include both activity/input metrics (e.g., emails sent, budget deployed) and result/output metrics (e.g., CTR, view-through rate, add-to-cart rate). Tag each as “candidate leading” or “candidate lagging” for the defined outcome.
- Hypothesize causal links and lead times.
For each candidate leading indicator, articulate the hypothesis: “If X moves by Y within Z days, we expect Outcome O to move by P within Q weeks.” Use prior experience, operational logic, and preliminary analysis to set an initial view of timing and elasticity. Keep it simple and falsifiable.
- Validate with data and experiments.
Use historical data to test relationships and lags (e.g., cross-correlation over multiple windows; cohort analyses; pre/post tests). Where feasible, run controlled experiments or holdouts to discern causality. Be pragmatic: look for robust, directional relationships rather than perfect precision.
- Select the minimal indicator set.
Choose 3–7 leading indicators and 2–4 lagging indicators per objective. Favor metrics that are predictive, controllable, timely, and resistant to gaming. Define clear metric definitions, owners, and target cadences (e.g., weekly for leading; monthly/quarterly for lagging).
- Set targets and thresholds.
Translate your strategy into numeric targets for each indicator and define “green/amber/red” thresholds based on historic variability and ambition. For leading indicators, set intervention triggers (e.g., if qualified pipeline dips below 0.8× coverage, activate acceleration playbook).
- Build a simple indicator tree and dashboard.
Publish the chain from activities to outcomes, with definitions and data sources. Configure a concise dashboard that shows trends, lead times, and conversion ratios. Include sparklines, not just snapshots, so teams can see trajectories early.
- Run a regular performance dialogue.
Institute a weekly rhythm focused on leading indicators: what’s moving, why, and what action will we take now? Complement with a monthly/quarterly review centered on lagging outcomes and structural improvements. Keep the conversation analytical and action-oriented, not just descriptive.
- Iterate and refresh.
Reassess the indicator set quarterly or after major changes in channels, creative, product, or pricing. Retire indicators that lose predictive power; add new ones as the business evolves. Document changes to preserve continuity and learning.
Practical examples of leading indicators in marketing
- B2B: Speed-to-lead (minutes to first contact), share of ICP (ideal customer profile) within MQLs, sales acceptance rate, stage-to-stage conversion, pipeline coverage (by segment), demo-to-opportunity conversion, POC activation rate.
- B2C/DTC: Brand search index, product page view rate from paid media, add-to-cart rate, checkout start rate, payment success rate, repeat purchase within 30 days, subscription activation and early churn flags (e.g., failed first payment).
- Brand: Share of voice, ad recall lift, consideration lift, positive sentiment share, review velocity, aided/unaided awareness among target segments.
6. Example: The Framework in Action
Context: A $500M D2C apparel brand saw flat quarterly revenue and rising CAC. The executive team needed faster feedback to steer spend across paid social, search, and influencer channels while rebuilding the brand.
Application: The team clarified outcomes: quarterly revenue growth and 12-month CLV for new customers. They mapped the funnel, inventoried metrics, and hypothesized that three leading indicators would be predictive:
- Brand search volume (weekly), as an early proxy for consideration.
- Product detail page (PDP) views per qualified session, as a signal of shopper intent.
- Add-to-cart rate from PDP, as the final pre-conversion behavior.
Historical analysis showed that a 1-point increase in brand search index typically preceded a 0.6–0.8% lift in weekly revenue with a two-week lag, controlling for seasonality. PDP view rate and add-to-cart rate each showed strong same-week correlations with conversion and predicted short-term revenue with high reliability.
Decisions and actions: The brand set weekly targets for the three leading indicators and tied channel tactics to them. For brand search, they increased upper-funnel video investment and optimized creative for distinctiveness; for PDP view rate, they improved ad-to-landing page congruence and navigation; for add-to-cart rate, they tested price anchoring and simplified size selection.
Results: Within six weeks, brand search index rose 12%, PDP view rate increased 15%, and add-to-cart rate improved 9%. Two weeks later, revenue trended up 7% versus baseline, CAC stabilized, and 90-day CLV for new cohorts rose 5%. The team institutionalized the indicator chain in a quarterly performance review and continued to refine it.
7. Strengths and Limitations
Strengths
- Sharper, earlier steering: Enables timely course-correction before results are “baked in.”
- Clear line-of-sight: Links daily marketing work to strategic outcomes, improving alignment and accountability.
- Common language: Creates a shared, concise narrative across marketing, sales, product, and finance.
- Focus: Forces prioritization of a small set of meaningful metrics over long lists of vanity measures.
- Adaptable: Works across B2B/B2C, brand and performance marketing, and different growth stages.
Limitations
- Not a causal guarantee: Correlation can mislead; without experiments or strong logic, indicators can be falsely “leading.”
- Static relationships can break: Platform changes, seasonality shifts, or competitive moves can alter lead times and elasticities.
- Lagging outcomes still matter: Over-focusing on leading indicators can distract from the ultimate goals and financial realities.
- Potential for gaming: If incentives are tied to poorly designed indicators, teams may optimize the metric rather than the outcome.
- Data requirements: Needs consistent definitions, reliable instrumentation, and enough volume to see signal.
8. Common Pitfalls (and How to Avoid Them)
- Vanity metrics masquerading as leading indicators
What goes wrong: Teams track easy-to-move numbers (e.g., impressions) with weak linkage to outcomes.
How to avoid: Demand evidence of predictive power or strong operational logic; prefer qualified or quality-adjusted versions (e.g., qualified reach, engaged sessions).
- Confusing correlation with causation
What goes wrong: Spurious relationships drive misguided decisions.
How to avoid: Use experiments or natural tests when possible; triangulate with multiple indicators; document assumptions and revisit them.
- Ignoring lead times
What goes wrong: Teams expect immediate lagging results and misjudge campaign performance.
How to avoid: Set realistic lead times by channel and objective; stage gates and patience windows in your review cadence.
- Too many indicators
What goes wrong: Signal gets lost in noise; teams chase metrics rather than outcomes.
How to avoid: Ruthlessly prioritize 3–7 leading indicators per objective; remove metrics that don’t inform decisions.
- Inconsistent definitions
What goes wrong: Disputes in meetings; unreliable trendlines.
How to avoid: Publish a metric dictionary with owner, formula, inclusion/exclusion rules, and data source.
- Perverse incentives and gaming
What goes wrong: Teams optimize the metric (e.g., over-qualify leads) at the expense of real outcomes.
How to avoid: Balance with counter-metrics (e.g., MQL quality), audit periodically, and tie incentives to both leading and lagging indicators.
- Set-and-forget indicator sets
What goes wrong: Relationships drift; dashboards grow stale.
How to avoid: Review and refresh quarterly; retire metrics that lose predictive value; add new ones thoughtfully.
- No action triggers
What goes wrong: Dashboards inform but don’t drive decisions.
How to avoid: Define clear thresholds and playbooks—what action is taken when a leading indicator turns amber or red.
9. How It Relates to Other Frameworks
- Balanced Scorecard: A natural complement. Balanced Scorecard provides the multi-perspective structure (financial, customer, internal process, learning & growth); leading vs lagging clarifies the metric relationships and cadences within each perspective.
- OKRs (Objectives and Key Results): Pair OKRs with this framework by making Key Results a mix of lagging outcomes and a few high-quality leading indicators. Use indicator chains to select KRs and set realistic timelines.
- Marketing funnel and AARRR/Pirate Metrics: Funnels outline stages; leading/lagging distinguishes which stage metrics predict outcomes and by how much. Use together to pick stage-specific leading indicators.
- Marketing Mix Modeling (MMM) and Attribution: MMM and attribution quantify contributions and lags across channels. Use them to validate lead times and elasticities of leading indicators, especially for upper-funnel and cross-channel effects.
- North Star Metric (NSM): An NSM provides a single organizing metric. The leading/lagging framework decomposes the NSM into actionable leading drivers and ties it to financial lagging outcomes.
- Test-and-learn (A/B testing), PDCA, OODA: Experimentation and continuous improvement provide the mechanism to validate and act on leading indicators. The frameworks are complementary.
Choice considerations: When you need strategic context and alignment, start with Balanced Scorecard or OKRs and then use the leading/lagging framework to choose and manage the right measures. When you need channel budget allocation, combine with MMM/attribution to quantify and forecast impacts.
10. Key Takeaways
- The Leading vs Lagging Indicators Framework separates predictive signals from recorded outcomes to enable earlier, better decisions in marketing.
- Define clear lagging outcomes first, then select a small set of leading indicators with proven or strongly reasoned linkages, realistic lead times, and owner-controlled levers.
- Use indicator chains, targets, and action thresholds to turn metrics into a management system, not just a dashboard.
- Validate relationships with data and experiments, and refresh the indicator set as channels, creative, and markets evolve.
- Beware vanity metrics, correlation traps, and gaming; balance leading indicators with counter-metrics and ultimate financial outcomes.
11. FAQs About the Leading vs Lagging Indicators Framework
Is the framework still relevant in today’s digital, privacy-constrained marketing environment?
Yes. If anything, it is more important. With delayed or partial conversion data, reliable leading indicators (e.g., brand search, qualified engagement, first-party signals) provide earlier, privacy-resilient feedback. The key is to validate linkages and adjust for platform and policy changes.
How do I choose the right lead time for a leading indicator?
Start with business logic (e.g., average sales cycle, time from exposure to purchase) and test multiple windows using historical data. Triangulate with experiments where possible. Expect different lead times by channel (search vs video), segment, and product. Document assumptions and revisit quarterly.
What’s the difference between a leading indicator and a North Star Metric?
A North Star Metric is a single, organizing measure of value creation. A leading indicator is any metric that predicts a lagging outcome. Your North Star may be a lagging outcome (e.g., revenue) or a value proxy; you then use leading indicators to drive it and to anticipate its movement.
Can small or early-stage companies use this framework?
Yes, but keep it lightweight. Pick one lagging outcome and 2–3 leading indicators with short lead times and direct controllability. As data volume grows, refine the set and add sophistication (e.g., cohort analyses, simple experiments).
How long does it take to implement in a real project?
A focused team can define outcomes, map the funnel, and select an initial indicator set in 2–3 weeks. Validating relationships and building a working dashboard typically takes 4–8 weeks, depending on data availability and experimentation cadence. Expect ongoing iteration thereafter.
