

1. What Is the Marketing KPI Tree Framework?
The Marketing KPI Tree Framework is a structured way to break down top-level business outcomes into hierarchical, cause-and-effect metrics that marketing can influence and manage. Starting from the enterprise goal (e.g., profitable revenue), a KPI tree decomposes it into value drivers (e.g., qualified demand, conversion, price realization, retention) and then into operational levers (e.g., channel reach, creative effectiveness, site speed, promo compliance). The result is a single picture that links day-to-day marketing activity to financial outcomes.
As a measurement, analytics, and performance management tool, the framework turns a scattered list of KPIs into a system. It clarifies how metrics relate, where to intervene, and how to set targets that add up. Well-built trees help leaders diagnose gaps, prioritize initiatives, and align teams on what moves the needle—without chasing vanity metrics.
Consultants and executives use KPI trees to connect marketing to P&L—tying brand and demand metrics to revenue, margin, customer lifetime value (CLV), and price realization. The framework is equally useful in B2C and B2B (including ABM), and across routes to market (D2C, retail, marketplaces, partners).
2. Origin and Background
Origin: Unknown; in use since at least the 1990s in strategy and performance management. KPI trees build on classic driver trees used in corporate finance and operations, adapted for modern marketing and digital analytics.
Why it emerged: As marketing diversified across channels and data exploded, leaders needed a causal blueprint to translate enterprise goals into measurable drivers. KPI trees made dependencies explicit (e.g., revenue = traffic × conversion × average order value), improving diagnosis, target setting, and cross-functional alignment.
How it spread: Through management consulting, marketing operations, and analytics teams, and later via growth and product frameworks that popularized “North Star” metrics with driver trees.
3. How the Marketing KPI Tree Framework Works
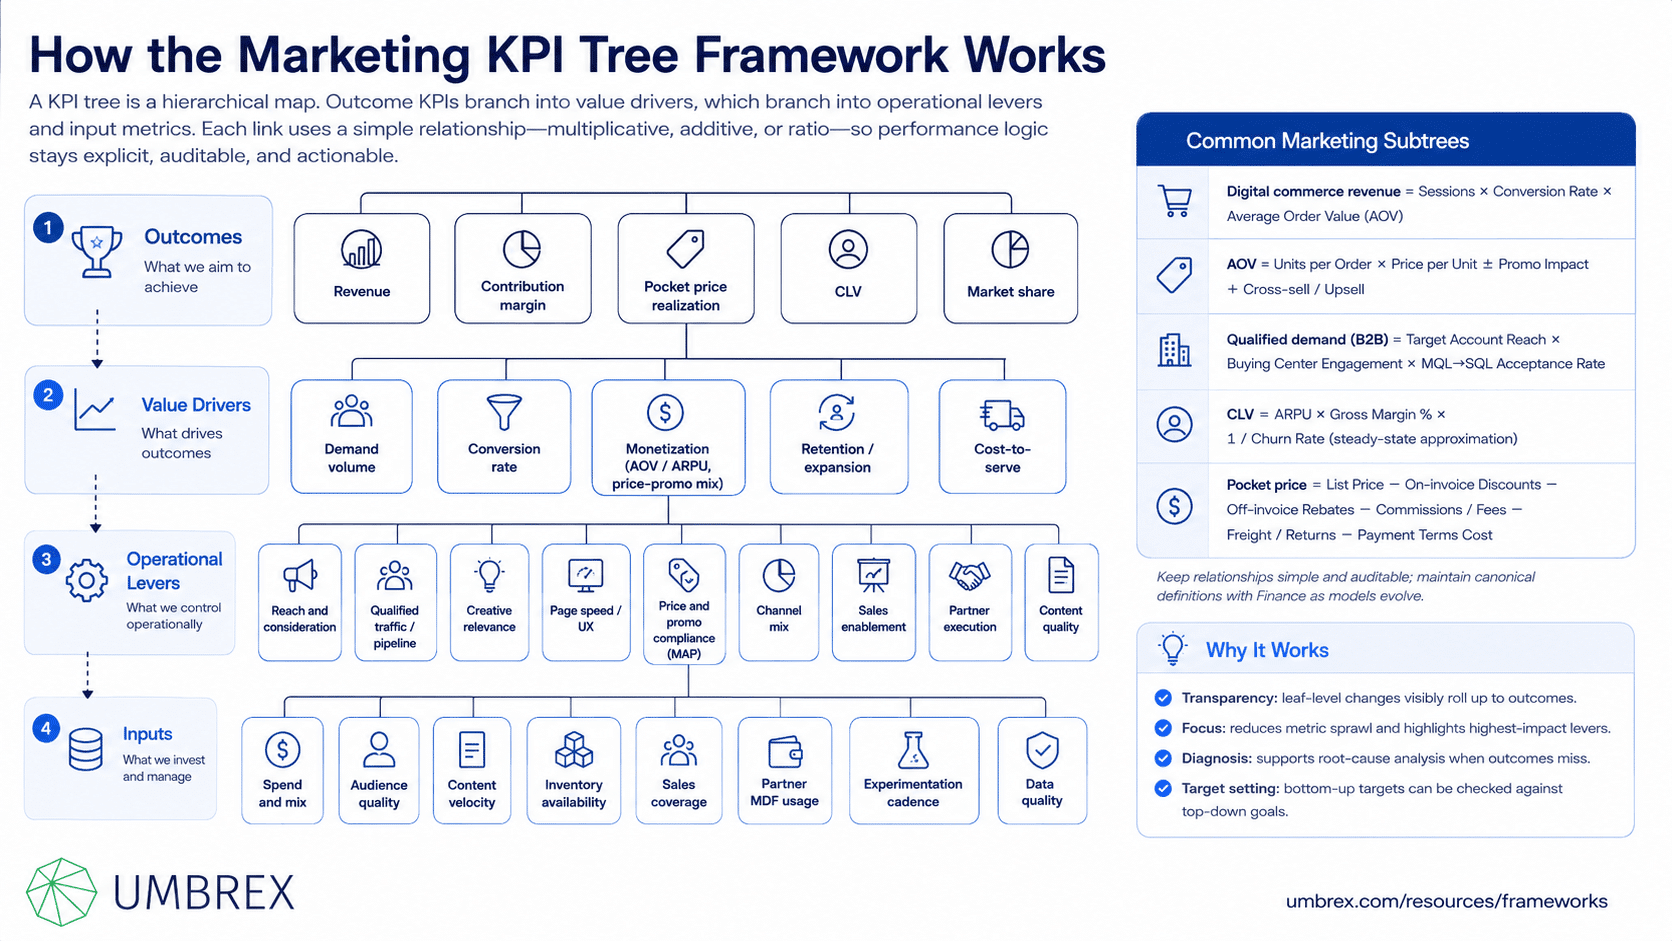
A KPI tree is a hierarchical map. At the top sit outcome KPIs (financial and customer). These branch into value drivers, which branch further into operational levers and input metrics. Each link is defined by a simple relationship (multiplicative, additive, or ratio). The power lies in explicit logic, standard definitions, and governance.
Typical Structure
- Outcomes: Revenue, contribution margin, pocket price realization, CLV, market share.
- Value Drivers: Demand volume, conversion rate, monetization (AOV/ARPU, price/promo mix), retention/expansion, cost-to-serve.
- Operational Levers: Reach and consideration, qualified traffic/pipeline, creative relevance, page speed/UX, price and promo compliance (MAP), channel mix, sales enablement, partner execution, content quality.
- Inputs: Spend and mix, audience quality, content velocity, inventory availability, sales coverage, partner MDF usage, experimentation cadence, data quality.
Common Marketing Subtrees (illustrative)
- Digital commerce revenue = Sessions × Conversion Rate × Average Order Value (AOV)
- AOV = Units per Order × Price per Unit ± Promo Impact (discounts) + Cross-sell/Upsell
- Qualified demand (B2B) = Target Account Reach × Buying Center Engagement × MQL→SQL Acceptance Rate
- CLV = ARPU × Gross Margin % × 1/(Churn Rate) (approximation for steady-state subscriptions)
- Pocket price = List Price − On-invoice Discounts − Off-invoice Rebates − Commissions/Fees − Freight/Returns − Payment Terms Cost
Relationships should be kept simple and auditable. Where formulas get complex (e.g., CLV), maintain a canonical definition with Finance and iterate as models mature.
Why It Works
- Transparency: Shows how changes at the leaf level roll up to outcomes, making trade-offs and priorities explicit.
- Focus: Cuts metric sprawl; highlights a handful of levers with highest impact and owner accountability.
- Diagnosis: When outcomes miss, the tree guides root-cause analysis (“Is it traffic, conversion, or AOV? Which subdriver?”).
- Target setting: Bottom-up targets must add up to top-down ambitions; trees make the math visible.
4. When to Use the Marketing KPI Tree Framework
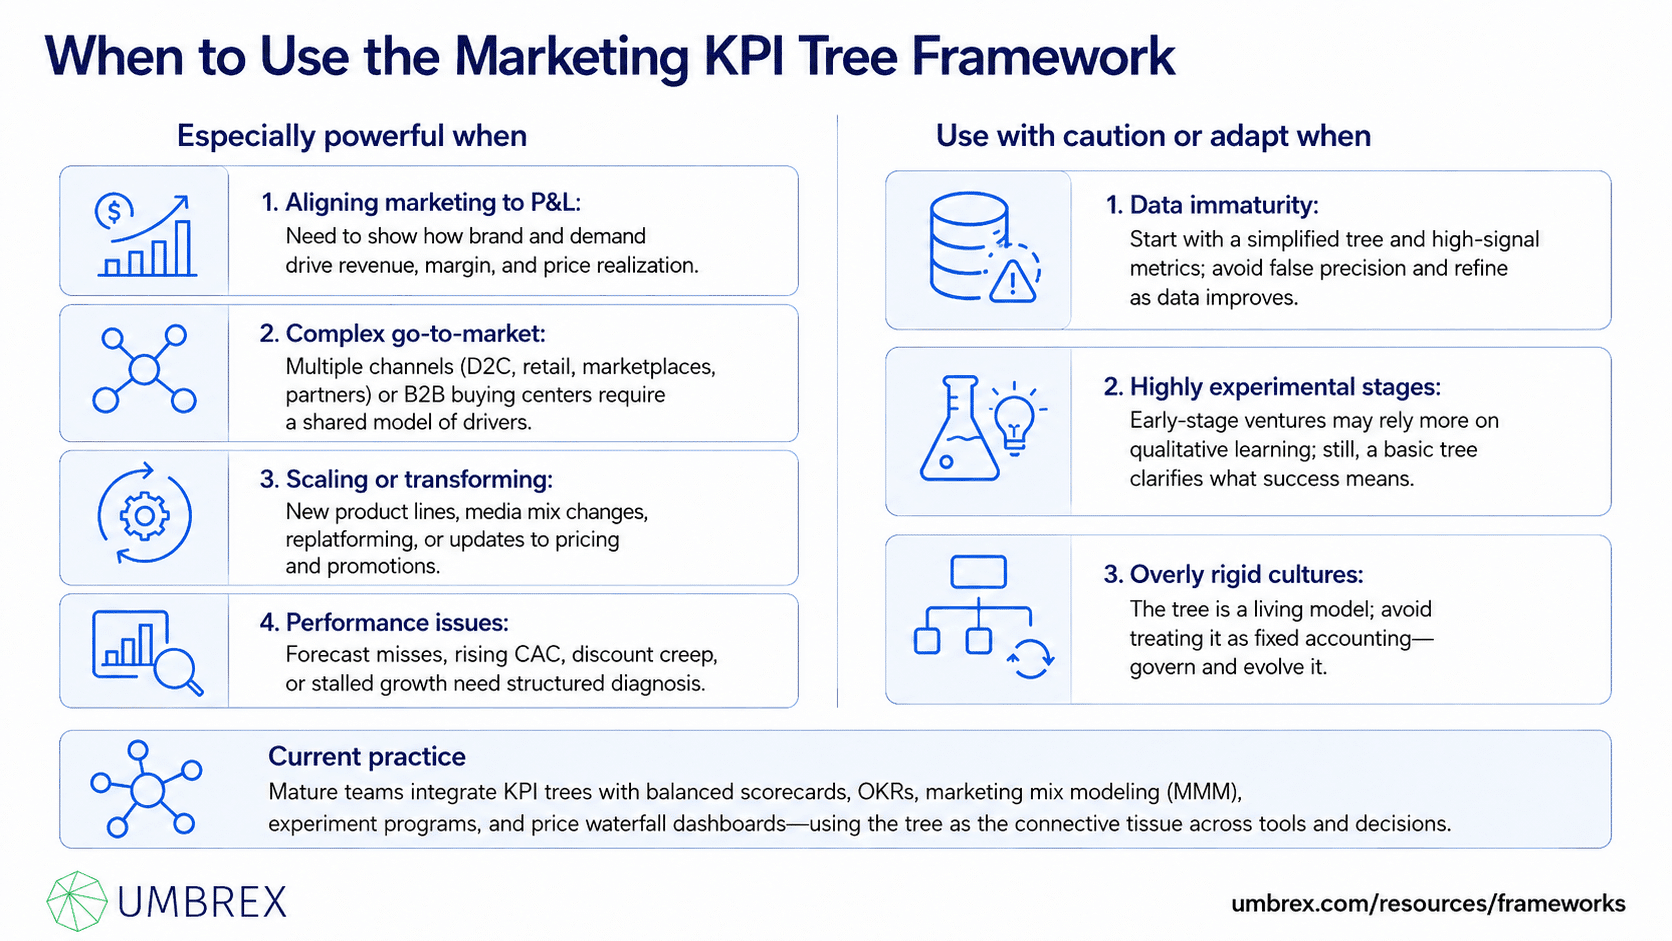
Especially powerful when:
- Aligning marketing to P&L: Need to show how brand and demand drive revenue, margin, and price realization.
- Complex go-to-market: Multiple channels (D2C, retail, marketplaces, partners) or B2B buying centers require a shared model of drivers.
- Scaling or transforming: New product lines, media mix changes, replatforming, or updates to pricing and promotions.
- Performance issues: Forecast misses, rising CAC, discount creep, or stalled growth need structured diagnosis.
Use with caution or adapt when:
- Data immaturity: Start with a simplified tree and high-signal metrics; avoid false precision and refine as data improves.
- Highly experimental stages: Early-stage ventures may rely more on qualitative learning; still, a basic tree clarifies what success means.
- Overly rigid cultures: The tree is a living model; avoid treating it as fixed accounting—govern and evolve it.
Current practice: Mature teams integrate KPI trees with balanced scorecards, OKRs, marketing mix modeling (MMM), experiment programs, and price waterfall dashboards—using the tree as the connective tissue across tools and decisions.
5. How to Apply the Marketing KPI Tree Framework: Step-by-Step
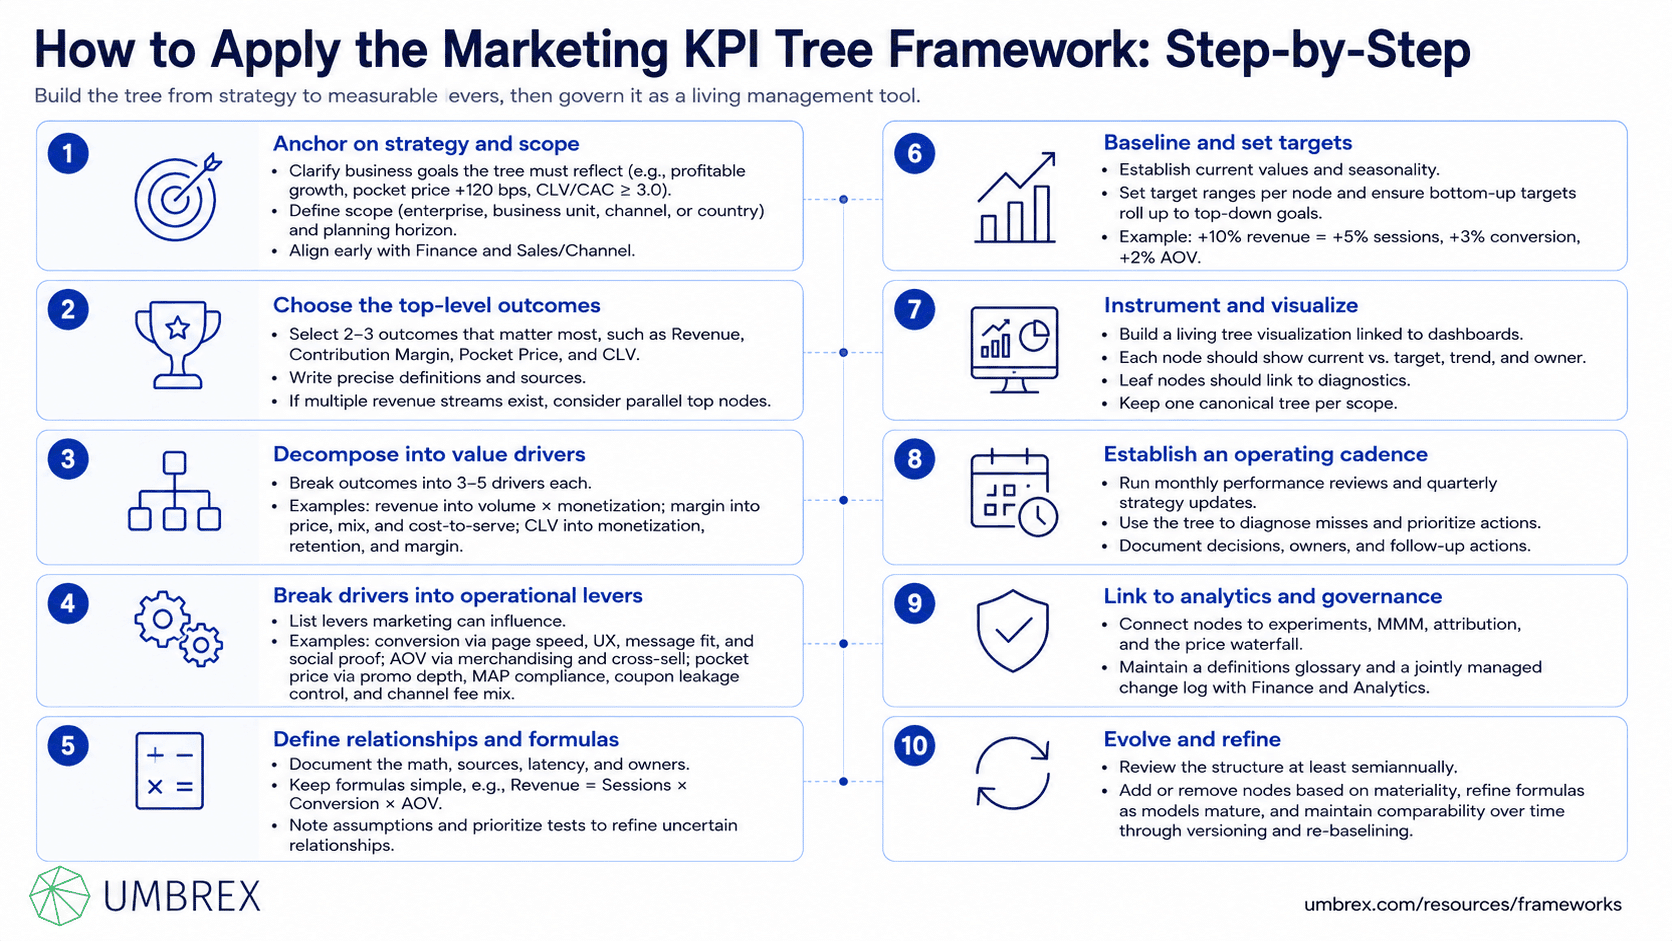
- Anchor on strategy and scope
Clarify the business goals the tree must reflect (e.g., “Profitable growth with pocket price +120 bps and CLV/CAC ≥ 3.0”). Define the scope (enterprise, business unit, channel, or country) and the planning horizon. Align with Finance and Sales/Channel at the outset.
- Choose the top-level outcomes
Select 2–3 outcomes that matter most (e.g., Revenue, Contribution Margin, Pocket Price, CLV). Write precise definitions and sources. If multiple revenue streams exist (subscriptions, transactions, services), consider parallel top nodes.
- Decompose into value drivers
Break outcomes into 3–5 drivers each. For revenue, a common split is Volume × Monetization (e.g., demand × conversion × AOV/ARPU). For margin, decompose into price, mix, and cost-to-serve. For CLV, split monetization, retention, and margin.
- Break drivers into operational levers
For each driver, list levers marketing can influence. Example: Conversion → page speed, UX friction, creative/message fit, offer relevance, social proof; AOV → merchandising, cross-sell, promotion design; Pocket Price → promo depth/frequency, MAP compliance, coupon leakage control, channel fee mix.
- Define relationships and formulas
Document the math (e.g., Revenue = Sessions × Conversion × AOV), data sources, latency, and owners. Keep formulas simple; where uncertainty exists, note assumptions and prioritize tests to refine coefficients (e.g., brand lift to consideration to conversion).
- Baseline and set targets
Establish current values (include seasonality) and agree on target ranges per node. Make bottom-up targets roll up to top-down goals. Example: If revenue target implies +10% growth, specify the mix (e.g., +5% sessions, +3% conversion, +2% AOV) with owners and initiatives.
- Instrument and visualize
Build a living tree visualization linked to dashboards. Each node should display current value vs. target, trend, and owner; leaf nodes link to diagnostics. Keep to one canonical tree per scope to avoid version sprawl.
- Establish an operating cadence
Run monthly performance reviews and quarterly strategy updates. Use the tree to diagnose misses and prioritize actions (e.g., “Conversion miss traced to mobile page speed and low review density; initiative plan locked.”). Document decisions and owners.
- Link to analytics and governance
Connect nodes to measurement methods: experiments for causal lift, MMM for budget allocation, attribution for path insights, price waterfall for realization. Create a definitions glossary and change-log managed jointly with Finance and Analytics.
- Evolve and refine
Review structure at least semiannually. Add/remove nodes based on materiality; refine formulas as models mature; maintain comparability over time by versioning changes and re-baselining when needed.
6. Example: KPI Tree in Action
Company: “RiverNorth,” a $450M omnichannel consumer brand selling via D2C, marketplaces, and retail partners.
Problem: Revenue growth stagnated despite higher spend; discounts increased; marketplaces undercut D2C; leadership lacked a unified view of where performance broke down. The CFO questioned brand spend and demanded clearer linkage to margin and price realization.
Approach: Built a Marketing KPI tree for North America with three top nodes: Revenue, Contribution Margin, and Pocket Price.
- Revenue subtree:
- Revenue = Sessions (D2C) + Retail Sell-through + Marketplace Orders, each × Conversion × AOV
- Sessions decomposed to: Reach × CTR × Site Availability; Reach split by media (upper funnel, performance, CRM), with MMM-driven weights
- Conversion decomposed to: Page Speed, UX Friction Index, Creative Fit Score, Review Density, Inventory In-stock Rate
- AOV decomposed to: Units per Order, Price per Unit, Cross-sell Attach, Promo Depth
- Contribution Margin subtree:
- Contribution = Revenue × Gross Margin % − Marketing Spend − Variable Fulfillment Costs
- Gross Margin % split to: Product Cost, Price Mix, Promo Mix
- Pocket Price subtree (by route):
- Pocket Price = List − On-invoice Discounts − Off-invoice Rebates − Commissions/Fees − Freight/Returns − Payment Terms Cost
- Levers: Promo Calendar (depth/frequency), Coupon Leakage Controls, MAP Compliance Rate, Channel Fee Mix, Returns Rate
Targets and initiatives: To deliver +9% revenue and +120 bps pocket price:
- Sessions +6% via reallocation from low-ROI retargeting to high-lift upper-funnel; improve Share of Search +10%.
- Conversion +2 pts through mobile page speed fixes and review program; A/B tested creative to lift message fit.
- AOV +1% through cross-sell bundles; promo depth reduced 15% with fenced offers.
- Pocket price +120 bps via coupon controls (single-use codes), MAP monitoring, and promo calendar harmonization across channels.
Results (12 weeks pilot, 24 weeks full rollout): Sessions +7%, conversion +1.8 pts, AOV +1.3%; pocket price +140 bps; contribution margin +180 bps. MMM and experiments validated causal gains. Retail partners reported steadier sell-through; marketplace buy-box win rate +13 pts. The KPI tree became the monthly operating artifact linking marketing actions to P&L outcomes.
7. Strengths and Limitations
Strengths
- End-to-end line of sight: Connects activities to financial outcomes, enabling better prioritization and resource allocation.
- Shared language: Aligns Marketing, Finance, Sales/Channel, and Product on definitions and cause–effect.
- Faster diagnosis: Speeds root-cause analysis and directs tests to the highest-impact levers.
- Target integrity: Ensures bottom-up commitments add to top-down goals; surfaces unrealistic assumptions early.
Limitations
- Data/definition sensitivity: Poor definitions or inconsistent sources lead to bad decisions; governance is essential.
- False precision risk: Overly complex formulas can mislead; prefer simple, auditable relationships and validate with experiments/MMM.
- Static drift: Trees must evolve with business models, channels, and pricing policies; neglect creates misalignment.
- Not a substitute for causal inference: Trees show structure; tests and models estimate true impact.
8. Common Pitfalls (and How to Avoid Them)
- Vanity metrics at the leaves
What goes wrong: Optimizing clicks or impressions without outcome linkage.
How to avoid: Keep a tight chain to outcomes; require documented relationships and routine validation. - Double counting across branches
What goes wrong: Attributing the same revenue to multiple channels or tactics.
How to avoid: Define allocation rules (MMM, attribution) and a single source of truth; reconcile totals to Finance. - Ignoring price realization
What goes wrong: Revenue grows but margin declines due to discount leakage and fees.
How to avoid: Include a pocket price subtree tied to the price waterfall; set floors and compliance metrics. - Overcomplex trees
What goes wrong: 100+ nodes; no one owns it.
How to avoid: Prioritize material drivers; cap nodes per branch; assign owners and deprecate low-impact leaves. - Stale definitions and targets
What goes wrong: KPI drift; teams optimize against outdated baselines.
How to avoid: Quarterly reviews; versioning and baselining; publish a glossary. - Lag-only focus
What goes wrong: Acting only after revenue drops.
How to avoid: Mix leading indicators (consideration, Share of Search, test velocity) with lags; define expected time lags. - Data latency and quality blind spots
What goes wrong: Decisions on outdated or inconsistent data.
How to avoid: Track data latency/coverage as KPIs; invest in pipelines and QA; annotate outages.
9. How the Marketing KPI Tree Framework Relates to Other Frameworks
- Marketing Balanced Scorecard: The scorecard defines a balanced set of objectives and KPIs; the KPI tree shows causal structure and roll-ups. Use both: scorecard for governance, tree for diagnosis and target math.
- OKRs: OKRs set priorities and outcomes; the KPI tree ensures Key Results aggregate to business goals and shows which levers drive them.
- Sales Funnel (Lead–Qualified–Proposal–Close): Funnel stages populate branches for qualified demand and conversion; tree clarifies which stage limits growth.
- ABM Framework: ABM engagement, buying center coverage, and progression flow into the demand subtree; trees tie ABM to pipeline, ASP, and discount incidence.
- Price Waterfall: Pocket price subtree mirrors the waterfall to track and improve price realization across channels and promotions.
- MMM, Attribution, and Experimentation: These methods quantify node sensitivities and causal impact; the tree organizes where to apply them.
- Territory & Coverage / Channel Conflict: Coverage, sell-through, and MAP compliance are branches that link channel execution to outcomes.
Practical sequence: Define scorecard and OKRs → Build KPI tree and target math → Instrument analytics (MMM, tests, attribution) → Operate monthly with the tree as the diagnostic and prioritization tool.
10. Key Takeaways
- The Marketing KPI Tree Framework decomposes outcomes into value drivers and operational levers, creating a clear line of sight from activity to P&L.
- Keep formulas simple, definitions tight, and ownership clear; use trees for target math, diagnosis, and prioritization.
- Include price realization via a pocket price subtree tied to the price waterfall to avoid “revenue up, margin down.”
- Integrate with scorecards, OKRs, MMM, and experiments; govern the tree with Finance and evolve it as the business changes.
- Avoid vanity metrics, double counting, overcomplexity, and lag-only focus; mix leading and lagging indicators with defined time lags.
11. FAQs About the Marketing KPI Tree Framework
How is a KPI tree different from a dashboard or a Balanced Scorecard?
A dashboard shows metrics; a Balanced Scorecard balances perspectives and governance; a KPI tree maps causal relationships and roll-ups. Use the tree to ensure metrics add up to outcomes and to direct action when performance drifts.
How many KPIs should a tree include?
At the enterprise/BU level, keep the core tree to 15–30 nodes (including outcomes and major drivers). Subtrees can add detail for teams, but prioritize material drivers and assign owners for each node.
What tools do we need?
Start with a whiteboard or diagram plus your BI stack (e.g., dashboards feeding each node). As you mature, link nodes to MMM outputs, experiment repositories, and price waterfall analytics. The operating model matters more than tooling.
Top-down or bottom-up—how do we build it?
Do both. Start top-down from outcomes to drivers to set structure, then validate bottom-up with data and stakeholders. Reconcile differences and iterate quickly.
How often should we update the tree?
Review monthly in performance meetings for variance diagnosis; update structure and definitions quarterly or semiannually. Version changes and re-baseline targets when structure shifts materially.
Can one tree cover multiple business models (e.g., D2C and wholesale)?
Use a master tree with branches per route (D2C, retail, marketplaces, partner-led) that roll to common outcomes (revenue, margin, pocket price). Maintain shared definitions (e.g., conversion) and route-specific subnodes (e.g., buy-box win rate).
How do we incorporate brand metrics credibly?
Include brand/consideration as leading indicators linked (with defined lags) to traffic, conversion, and price premium. Validate relationships with MMM and experiments, not just correlation.
How long to implement?
A focused initial tree and baseline can be built in 3–6 weeks. Embedding governance, refining data, and linking to MMM/experiments typically takes 1–2 quarters, after which it becomes the backbone of monthly marketing management.
