

1. What Is the OODA Loop (Observe, Orient, Decide, Act) Applied to Optimization?
The OODA Loop—short for Observe, Orient, Decide, Act—is a rapid, iterative decision framework originally developed for high‑speed competitive environments. Applied to digital optimization, it is a disciplined way to turn noisy, real‑time signals into better product, marketing, and ecommerce outcomes through fast, repeated cycles of learning and action.
In the context of digital, ecommerce, growth, and product, the OODA Loop is a practical operating model for experimentation and continuous improvement. It helps cross‑functional teams move from analysis to action quickly—cutting the time it takes to diagnose issues, test solutions, and scale what works across journeys such as acquisition, conversion, onboarding, and retention.
Consultants and growth leaders use OODA to bring rigor and speed to optimization. It creates a shared cadence across analytics, product, design, engineering, and marketing, ensuring that every cycle produces measurable learning and, ideally, compounding performance gains.
2. Origin and Background
Origin: The OODA Loop was created by Colonel John Boyd of the United States Air Force. Boyd developed the concept from the late 1950s through the 1980s, most notably in briefing papers and talks such as “Patterns of Conflict.”
Boyd designed OODA to explain why some pilots and commanders outperformed others: by cycling through Observe–Orient–Decide–Act faster and with better mental models, they could “get inside” the opponent’s decision loop and force errors. The idea later spread beyond the military into business strategy and operations as a way to thrive under uncertainty and rapid change.
In digital and growth contexts, OODA gained traction as companies sought to operationalize rapid experimentation—reinforced by agile development, analytics, and A/B testing tools that enable short learning cycles at scale.
3. How the OODA Loop Works
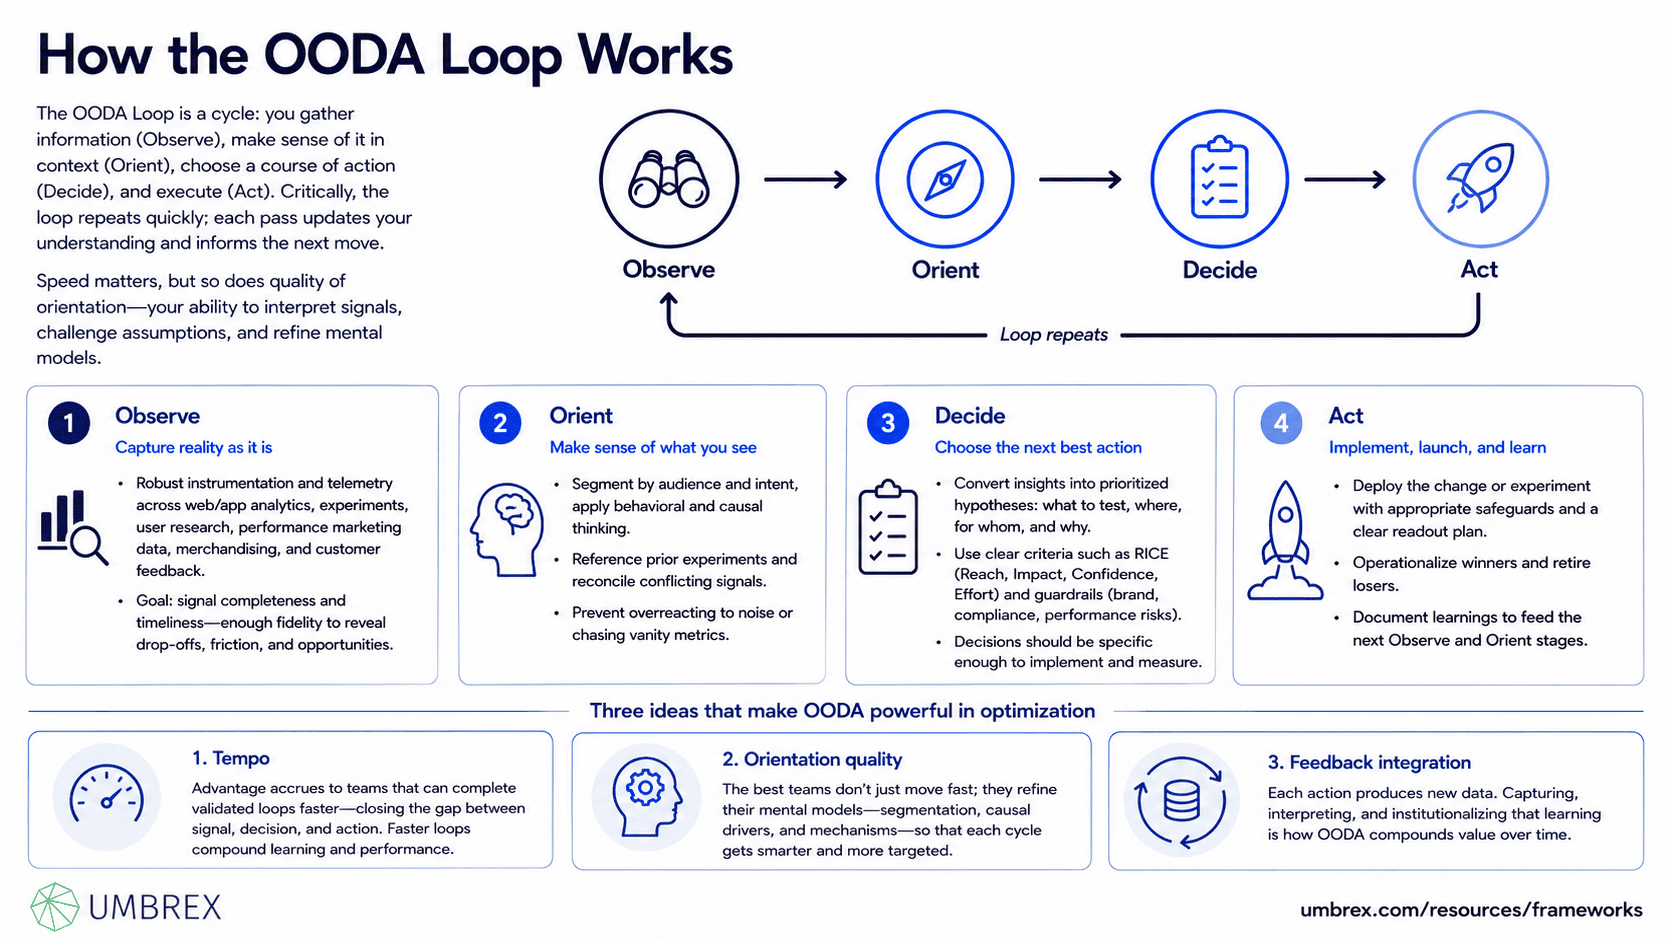
The OODA Loop is a cycle: you gather information (Observe), make sense of it in context (Orient), choose a course of action (Decide), and execute (Act). Critically, the loop repeats quickly; each pass updates your understanding and informs the next move. Speed matters, but so does quality of orientation—your ability to interpret signals, challenge assumptions, and refine mental models.
The Stages of OODA (Applied to Optimization)
- Observe: Capture reality as it is. In digital optimization, this means robust instrumentation and telemetry across web/app analytics, experiments, user research, performance marketing data, merchandising, and customer feedback. The goal is signal completeness and timeliness—enough fidelity to reveal drop‑offs, friction, and opportunities.
- Orient: Make sense of what you see. Orientation is where judgment and context turn data into insight. It involves segmenting by audience and intent, applying behavioral and causal thinking, referencing prior experiments, and reconciling conflicting signals. Orientation prevents teams from overreacting to noise or chasing vanity metrics.
- Decide: Choose the next best action. This is where you convert insights into prioritized hypotheses: what to test, where, for whom, and why. Use clear criteria (e.g., RICE—Reach, Impact, Confidence, Effort) and guardrails (brand, compliance, performance risks). Decisions should be specific enough to implement and measure.
- Act: Implement, launch, and learn. Deploy the change or experiment with appropriate safeguards and a clear readout plan. Acting also includes operationalizing winners, retiring losers, and documenting learnings to feed the next Observe and Orient stages.
Three ideas make OODA particularly powerful in optimization:
- Tempo: Advantage accrues to teams that can complete validated loops faster—closing the gap between signal, decision, and action. Faster loops compound learning and performance.
- Orientation quality: The best teams don’t just move fast; they refine their mental models—segmentation, causal drivers, and mechanisms—so that each cycle gets smarter and more targeted.
- Feedback integration: Each action produces new data. Capturing, interpreting, and institutionalizing that learning is how OODA compounds value over time.
4. When to Use the OODA Loop
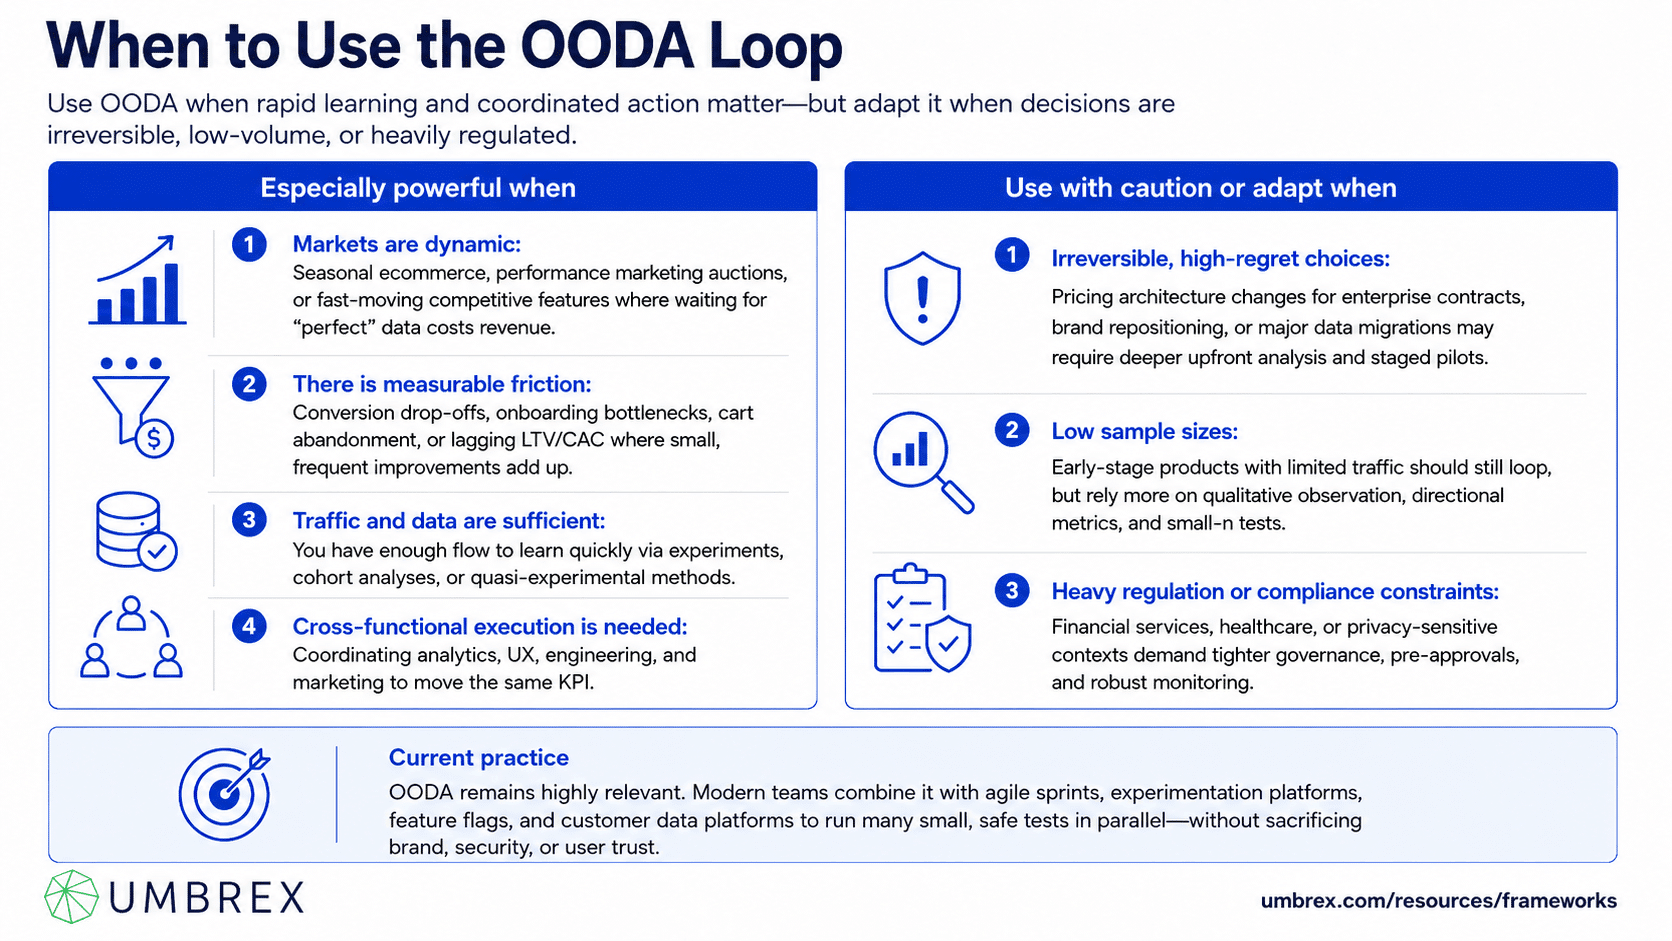
Especially powerful when:
- Markets are dynamic: Seasonal ecommerce, performance marketing auctions, or fast‑moving competitive features where waiting for “perfect” data costs revenue.
- There is measurable friction: Conversion drop‑offs, onboarding bottlenecks, cart abandonment, or lagging LTV/CAC where small, frequent improvements add up.
- Traffic and data are sufficient: You have enough flow to learn quickly via experiments, cohort analyses, or quasi‑experimental methods.
- Cross‑functional execution is needed: Coordinating analytics, UX, engineering, and marketing to move the same KPI.
Use with caution or adapt when:
- Irreversible, high‑regret choices: Pricing architecture changes for enterprise contracts, brand repositioning, or major data migrations may require deeper upfront analysis and staged pilots.
- Low sample sizes: Early‑stage products with limited traffic should still loop, but rely more on qualitative observation, directional metrics, and small‑n tests.
- Heavy regulation or compliance constraints: Financial services, healthcare, or privacy‑sensitive contexts demand tighter governance, pre‑approvals, and robust monitoring.
Current practice: OODA remains highly relevant. Modern teams combine it with agile sprints, experimentation platforms, feature flags, and customer data platforms to run many small, safe tests in parallel—without sacrificing brand, security, or user trust.
5. How to Apply the OODA Loop: Step-by-Step
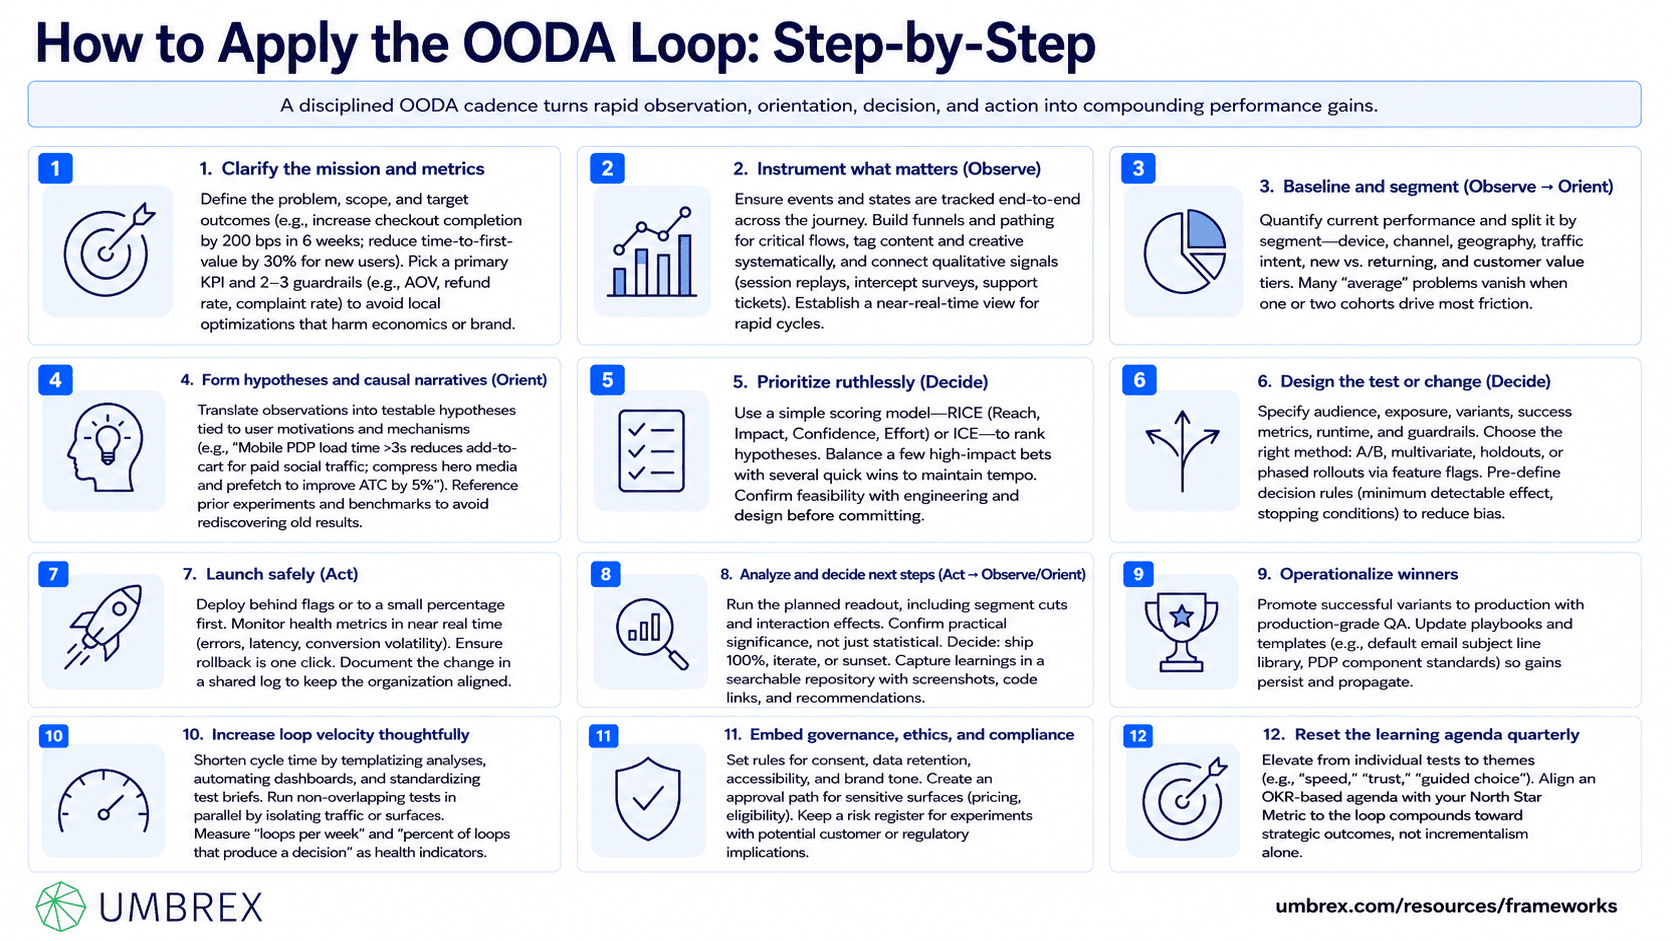
- Clarify the mission and metrics
Define the problem, scope, and target outcomes (e.g., increase checkout completion by 200 bps in 6 weeks; reduce time‑to‑first‑value by 30% for new users). Pick a primary KPI and 2–3 guardrails (e.g., AOV, refund rate, complaint rate) to avoid local optimizations that harm economics or brand.
- Instrument what matters (Observe)
Ensure events and states are tracked end‑to‑end across the journey. Build funnels and pathing for critical flows, tag content and creative systematically, and connect qualitative signals (session replays, intercept surveys, support tickets). Establish a near‑real‑time view for rapid cycles.
- Baseline and segment (Observe → Orient)
Quantify current performance and split it by segment—device, channel, geography, traffic intent, new vs. returning, and customer value tiers. Many “average” problems vanish when you see that one or two cohorts drive most friction.
- Form hypotheses and causal narratives (Orient)
Translate observations into testable hypotheses tied to user motivations and mechanisms (e.g., “Mobile PDP load time >3s reduces add‑to‑cart for paid social traffic; compress hero media and prefetch to improve ATC by 5%”). Reference prior experiments and benchmarks to avoid rediscovering old results.
- Prioritize ruthlessly (Decide)
Use a simple scoring model—RICE (Reach, Impact, Confidence, Effort) or ICE—to rank hypotheses. Balance a few high‑impact bets with several quick wins to maintain tempo. Confirm feasibility with engineering and design before committing.
- Design the test or change (Decide)
Specify audience, exposure, variants, success metrics, runtime, and guardrails. Choose the right method: A/B, multivariate, holdouts, or phased rollouts via feature flags. Pre‑define decision rules (e.g., minimum detectable effect, stopping conditions) to reduce bias.
- Launch safely (Act)
Deploy behind flags or to a small percentage first. Monitor health metrics in near real time (errors, latency, conversion volatility). Ensure rollback is one click. Document the change in a shared log to keep the organization aligned.
- Analyze and decide next steps (Act → Observe/Orient)
Run the planned readout, including segment cuts and interaction effects. Confirm practical significance, not just statistical. Decide: ship 100%, iterate, or sunset. Capture learnings in a searchable repository with screenshots, code links, and recommendations.
- Operationalize winners
Promote successful variants to production with production‑grade QA. Update playbooks and templates (e.g., default email subject line library, PDP component standards) so gains persist and propagate.
- Increase loop velocity thoughtfully
Shorten cycle time by templatizing analyses, automating dashboards, and standardizing test briefs. Run non‑overlapping tests in parallel by isolating traffic or surfaces. Measure “loops per week” and “percent of loops that produce a decision” as health indicators.
- Embed governance, ethics, and compliance
Set rules for consent, data retention, accessibility, and brand tone. Create an approval path for sensitive surfaces (pricing, eligibility). Keep a risk register for experiments with potential customer or regulatory implications.
- Reset the learning agenda quarterly
Elevate from individual tests to themes (e.g., “speed,” “trust,” “guided choice”). Align an OKR‑based agenda with your North Star Metric to ensure the loop compounds toward strategic outcomes, not incrementalism alone.
6. Example: OODA Loop in Action
Company: “NovaThreads,” a $350M global DTC apparel brand with strong paid social acquisition but soft mobile conversion (1.3%) and high cart abandonment.
Problem: Despite healthy traffic, mobile revenue lagged targets. Leadership needed faster learning and decisive action to improve conversion ahead of peak season.
Applying OODA:
- Observe: Instrumented mobile funnels from PDP to payment. Added event timing for image load, size selector interactions, and wallet usage. Ran 200 intercept surveys to understand abandonment reasons.
- Orient: Segment analysis showed paid social traffic on mid‑tier Android devices had 2–3s slower PDP loads and 25% higher size‑related returns. Surveys highlighted uncertainty about fit and delivery times. Prior tests indicated gains from social proof on desktop but mixed results on mobile.
- Decide: Prioritized four hypotheses:
- Compress PDP hero media and delay below‑the‑fold assets to improve add‑to‑cart.
- Introduce “Find My Fit” micro‑quiz before size selection for products with high return rates.
- Enable Apple Pay/Google Pay as the first checkout option for returning mobile users.
- Add localized delivery promise on PDP and cart for top 5 markets.
Used RICE scoring; all four were feasible within two sprints.
- Act: Launched each behind flags to 20% of eligible mobile traffic. Monitored conversion, latency, and support contacts daily. Readouts at 14 days with pre‑defined MDEs.
Results after 5 weeks: Mobile conversion rose from 1.3% to 1.55% overall (+25 bps), with paid social Android cohorts improving by 50 bps. Add‑to‑cart increased 6% on optimized PDPs; wallet usage grew from 12% to 28% among returners; “Find My Fit” reduced size‑related returns by 8% for targeted SKUs. Documented learnings informed a new PDP template and checkout defaults. The team increased loops per week from 3 to 6 without elevating risk, aided by better templates and dashboards.
Follow‑on actions: Operationalized the new PDP standard, expanded localized delivery messaging to 12 markets, and launched a quarterly learning theme on “trust and guidance” to explore UGC, returns education, and proactive sizing advice across categories.
7. Strengths and Limitations
Strengths
- Speed with discipline: Converts data into action quickly, with clear decision rules and guardrails.
- Compounding learning: Each loop refines mental models, raising the hit rate of future tests and changes.
- Cross‑functional alignment: Creates a shared operating cadence for analytics, product, engineering, and marketing.
- Adaptable to uncertainty: Performs well when conditions change—seasonality, competitive moves, or platform shifts.
- Scales from tactical to strategic: Works for micro‑optimizations (e.g., load time) and broader themes (e.g., trust, guidance, personalization).
Limitations
- Bias risk in Orientation: Poor mental models or overreliance on averages can send teams down the wrong path quickly.
- Local maxima: Fast iteration around the current design may miss step‑change opportunities; complement with periodic zero‑based redesigns.
- Data requirements: Sparse data limits loop velocity and confidence; you may need to rely more on qualitative insight and longer runtimes.
- Operational overhead: Without templates, tooling, and governance, running many loops can strain teams and create inconsistency.
- Risk of message or test overload: Excessive experiments or communications can harm UX and brand if not coordinated.
8. Common Pitfalls (and How to Avoid Them)
- Skipping Orientation
What goes wrong: Teams jump from dashboards to action, mistaking correlation for causation.
How to avoid: Require a short hypothesis brief tying behavior to a mechanism and referencing prior evidence before any test launches. - Chasing averages
What goes wrong: “Average” conversion hides cohort‑specific problems; broad changes underperform.
How to avoid: Always cut by device, traffic source, intent, and value tier. Decide at the segment level first. - Vanity metrics
What goes wrong: Optimizing click‑through or page views that don’t move revenue or retention.
How to avoid: Anchor every loop to a primary KPI with guardrails. Kill tests that lift superficial metrics but hurt unit economics. - Uncontrolled parallel tests
What goes wrong: Overlapping experiments create interference; readouts become ambiguous.
How to avoid: Use a centralized experimentation calendar, traffic allocation, and naming conventions. Isolate surfaces or audiences. - Underpowered experiments
What goes wrong: Inconclusive results waste time and erode trust in testing.
How to avoid: Estimate detectable effect sizes and sample needs upfront. Prefer bigger, clearer changes over many tiny tweaks when traffic is limited. - Slow loops
What goes wrong: Long cycle times reduce learning and advantage.
How to avoid: Standardize briefs and dashboards; automate instrumentation; aim for a weekly loop on at least one surface. - Poor documentation
What goes wrong: Teams repeat old tests and fail to scale wins.
How to avoid: Maintain a searchable repository of hypotheses, setups, results, and decisions. Review it during planning. - Ignoring brand, accessibility, or compliance
What goes wrong: Short‑term gains create long‑term risk or inequitable experiences.
How to avoid: Bake review gates into Decide/Act stages and maintain a risk register for sensitive tests. - Not operationalizing winners
What goes wrong: Gains evaporate when variants never become defaults.
How to avoid: Assign owners and timelines to harden successful variants and update templates and playbooks.
9. How the OODA Loop Relates to Other Frameworks
- PDCA (Plan–Do–Check–Act): PDCA emphasizes structured planning and control; OODA emphasizes speed and adaptive orientation. In fast‑moving digital contexts, OODA’s focus on tempo and mental models helps teams respond to volatility, while PDCA’s rigor is useful for steady‑state process control. Many organizations blend them—PDCA for governance, OODA for day‑to‑day optimization.
- Lean Startup (Build–Measure–Learn): BML and OODA are close cousins. OODA adds explicit “Orient,” highlighting the importance of prior beliefs, segmentation, and context. Use OODA when misinterpretation risk is high and orientation quality determines success.
- DMAIC (Define–Measure–Analyze–Improve–Control): Six Sigma’s DMAIC is powerful for defect reduction with stable processes. OODA is better for environments with shifting customer behavior and platforms, where frequent small decisions matter. Use DMAIC for root‑cause elimination in stable operations; OODA for growth and UX evolution.
- North Star Metric and OKRs: These provide direction and alignment. OODA is the operating loop that advances those goals week to week. Pair them: set quarterly OKRs, then run OODA cycles that ladder up.
- AARRR (Acquisition, Activation, Retention, Revenue, Referral): AARRR frames where to focus. OODA defines how to learn and act within each stage (e.g., an OODA program on Activation to improve onboarding).
- RICE/ICE Prioritization: These are tools inside the Decide stage. Use them to choose among hypotheses efficiently and transparently.
- HEART (Happiness, Engagement, Adoption, Retention, Task success): HEART offers UX metrics portfolios. OODA uses these as observation inputs and success measures for experiments.
Choosing the right tool: If the challenge is ambiguous and evolving, favor OODA. If the challenge is well‑defined defect reduction, favor DMAIC. If you need portfolio‑level direction, use North Star/OKRs and AARRR, then execute with OODA.
10. Key Takeaways
- OODA—Observe, Orient, Decide, Act—is a fast, iterative loop that turns real‑time signals into better marketing, product, and ecommerce outcomes.
- Its power comes from tempo and orientation quality: cycling quickly while refining the mental models that guide decisions.
- Use it when markets are dynamic and data is abundant; adapt it for low‑traffic or highly regulated contexts.
- Anchor every loop to a primary KPI with guardrails, prioritize via RICE/ICE, and operationalize winners so gains persist.
- Avoid common pitfalls: skipping orientation, chasing averages or vanity metrics, underpowered tests, and weak governance.
11. FAQs About the OODA Loop (Observe, Orient, Decide, Act)
Is the OODA Loop still relevant for digital optimization?
Yes. If anything, it’s more relevant today. Platform changes, evolving privacy norms, and shifting consumer behavior reward teams that can learn and act quickly with sound judgment. OODA provides that operating rhythm.
How is OODA different from PDCA or Build–Measure–Learn?
OODA places explicit emphasis on “Orient”—the models and context that shape interpretation—and on decision tempo. PDCA is stronger for process control; Build–Measure–Learn mirrors OODA but is often used for product discovery. In practice, many teams meld them.
Can small or early‑stage companies use OODA?
Absolutely. Start with lightweight loops: a clear KPI, a weekly cadence, simple RICE prioritization, and one or two tests at a time. Lean more on qualitative observation when traffic is limited.
How long does it take to run an effective OODA cycle?
For high‑traffic surfaces, a full cycle—from observation to decision to action and readout—can be 1–2 weeks. Complex changes or low‑traffic contexts may require 3–6 weeks. The goal is consistent, validated loops, not speed for its own sake.
What data volume do we need for OODA to work?
You need enough signal to reach confident decisions for your chosen KPI. For A/B tests, that means sufficient traffic to detect your minimum meaningful effect; when that’s not available, combine directional quantitative data with qualitative insight and holdouts or longer runs.
