

1. What Is the ICE Prioritization Framework (Impact, Confidence, Ease)?
The ICE Framework is a fast, practical method for ranking ideas and initiatives so teams work on the highest-return opportunities first. ICE stands for Impact, Confidence, and Ease. You assign a simple 1–10 score to each dimension for every idea in your backlog, then combine the scores to produce a single ICE score. The higher the score, the higher the priority.
In digital, ecommerce, growth, and product contexts, ICE is used to prioritize experiments, features, marketing campaigns, and operational improvements—especially when resources are constrained and the backlog is long. Its strength is speed and shared language: it turns subjective debates into structured judgments anchored in outcomes, evidence, and effort.
Teams use ICE in weekly or biweekly planning cycles to keep momentum. It’s intentionally lightweight; where more precision is warranted, you can complement it with economics (LTV/CAC, payback) and more granular models like RICE or WSJF. But as a default, ICE gives you a disciplined way to focus on what matters now.
2. Origin and Background
Origin: Popularized by Sean Ellis in the early 2010s within the growth hacking community as a simple scoring mechanism for experiment backlogs. Variants have since been adopted across product and marketing teams.
Why it was created: To help teams rank a flood of potential experiments without weeks of analysis. ICE reduced prioritization to three common-sense questions: How big could the impact be? How confident are we in that estimate? How easy is it to execute?
How it spread: Through startup accelerators, growth blogs, and experimentation playbooks. Today you’ll see ICE embedded in growth loops (ideate–prioritize–test–analyze), product councils, and CRO programs because it is quick to adopt and easy to teach.
3. How the ICE Framework Works

The core logic: for each idea, score three factors on a 1–10 scale, using pre-agreed rubrics to limit bias. Then combine scores to create a rank-ordered backlog.
Define the three dimensions
- Impact: The expected improvement on a target outcome if the idea succeeds. Anchor Impact to a specific metric (e.g., checkout conversion, activation rate, NPS, AOV, cost-to-serve) and your current stage goal.
- 10 = transformative (e.g., ≥10% relative lift or major cost reduction)
- 5 = moderate lift (e.g., 2–4%)
- 1 = negligible (e.g., <0.5%)
- Confidence: How strong is the evidence behind your Impact and Ease estimates? Consider data quality, prior tests, causal linkage, and market precedent.
- 10 = replicated wins in your context or strong causal evidence
- 5 = directional analytics or external benchmarks
- 1 = opinion-only or untested conjecture
- Ease: How much effort, time, and complexity are required? Include engineering/design/QA, dependencies, risk, and change management.
- 10 = can ship in a day or two with one squad; minimal risk
- 5 = one sprint with some cross-team coordination
- 1 = multi-quarter project with heavy dependencies
Combine scores
- Common formula: ICE score = (Impact + Confidence + Ease) / 3 (average). This keeps scores on a familiar 1–10 scale.
- Alternative: ICE score = Impact × Confidence × Ease (product). This exaggerates differences and penalizes any “low” dimension, but can be noisy. If you use multiplication, normalize scores (e.g., 1–5) to avoid runaway values.
- Weights: You can weight dimensions (e.g., more weight on Impact during a critical OKR), but document and limit changes; frequent weight-tweaking invites gaming.
The power of ICE lies less in the arithmetic and more in the discipline: aligned definitions, quick independent scoring, and a transparent decision about what to do next.
4. When to Use the ICE Framework
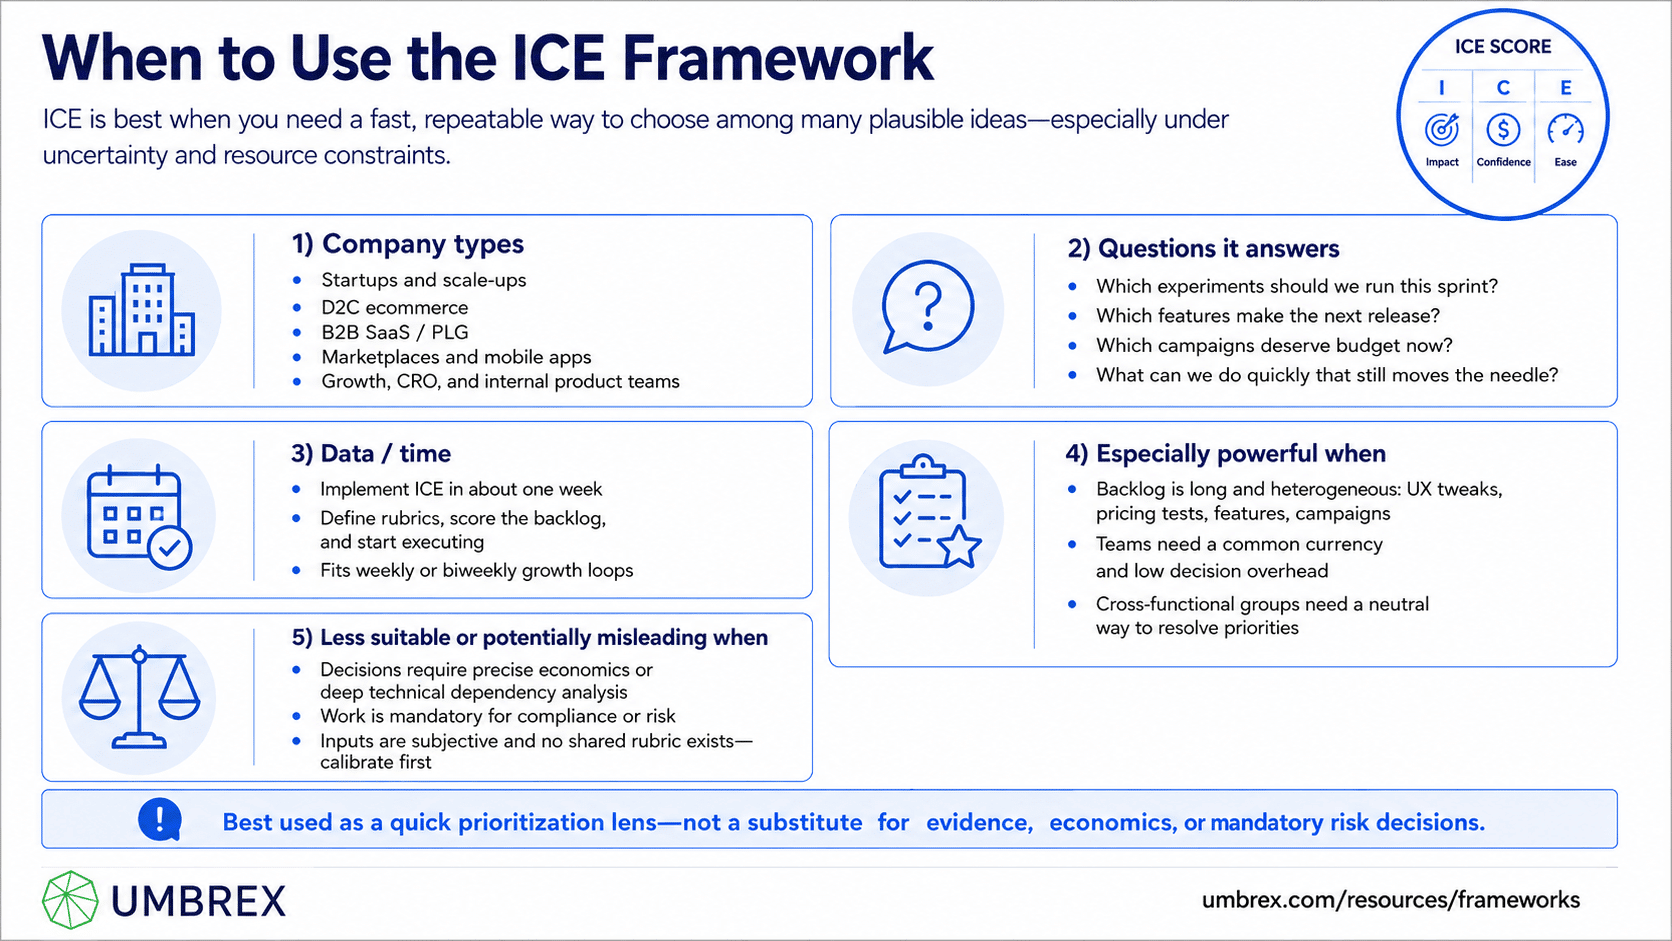
ICE is best when you need a fast, repeatable way to choose among many plausible ideas, especially under uncertainty and resource constraints.
- Company types: Startups and scale-ups; D2C ecommerce; B2B SaaS/PLG; marketplaces; mobile apps; growth and CRO teams; internal product teams in large enterprises.
- Questions it answers: Which experiments should we run this sprint? Which features make the next release? Which campaigns deserve budget now? What can we do quickly that still moves the needle?
- Data/time: You can implement ICE in a week: define rubrics, score the backlog, and start executing. It fits neatly into weekly/biweekly growth loops.
Especially powerful when:
- Your backlog is long and heterogeneous (UX tweaks, pricing tests, new features, campaigns) and you need a common currency.
- You have enough throughput to test multiple ideas each sprint and want to keep decision overhead low.
- Cross-functional teams need a neutral mechanism to resolve competing priorities.
Less suitable or potentially misleading when:
- Decisions hinge on precise economics or deep technical dependencies (consider RICE, WSJF, or full business cases).
- Ideas are “must-do” for compliance or risk; ICE is for prioritization, not for green-lighting mandatory work.
- Inputs are highly subjective with no shared rubric—ICE becomes opinion scoring. Calibrate first.
5. How to Apply ICE: Step-by-Step

- Define the objective and target metrics
Anchor Impact to a specific, time-bound goal (e.g., “Increase checkout conversion by 300 bps this quarter” or “Raise D30 retention by 4 pts”). Make the objective visible during scoring.
- Create scoring rubrics and anchors
Document what 1, 5, and 10 mean for Impact, Confidence, and Ease in your context. Include examples (e.g., “Move payment methods above the fold” may be Impact 4–6, Ease 7–8; “Add Shop Pay” might be Impact 6–8 depending on device mix, Ease 5–7).
- Assemble and sanitize the backlog
Collect ideas from analytics, user research, sales/support, competitive teardowns, and past experiments. Remove duplicates. Tag each idea with owner, scope, and dependencies.
- Pre-screen “non-negotiables”
Carve out mandatory items (security, compliance, reliability). ICE is for discretionary prioritization among impact-oriented ideas.
- Score independently, then reconcile
Have 2–3 people score each idea individually to reduce bias. Then hold a 30–60 minute session to reconcile differences and agree final scores. Capture rationale in one sentence per dimension.
- Compute ICE and rank
Use the average formula unless you have a strong reason to multiply. Sort by ICE, then apply practical filters (capacity, sequencing, dependencies). Select a portfolio for the next sprint: a few “quick wins” (high Ease), a few “big bets” (high Impact), and at least one learning-oriented test (build Confidence).
- Add guardrails and define success
For selected items, define primary metrics and guardrails (e.g., complaints, return rate, margin). Set minimal detectable effect (MDE), sample size, and stopping rules for experiments.
- Execute in sprints and measure
Run disciplined tests or deliver features. Update the backlog with actual outcomes and note whether Impact/Ease/Confidence were over- or under-estimated.
- Calibrate scores with reality
Quarterly, compare predicted vs. actual impact by idea class (e.g., checkout UX, new payment methods, PDP content). Adjust rubrics and team heuristics to reduce bias. Consider modest weights (e.g., +10% weight on Confidence if estimates have been noisy).
- Institutionalize the cadence
Make ICE part of your growth loop: ideate → prioritize (ICE) → test → analyze → learn. Keep the backlog fresh; archive stale items; celebrate wins and retire myths.
6. Example: ICE in Action
Context: “StyleLane,” a $120M D2C apparel brand, hit a conversion plateau. The CMO asked for a 90-day plan to lift revenue efficiently. The growth squad adopted ICE to rank 20+ ideas across PDP, checkout, and lifecycle.
Objective: +300 bps checkout conversion; +2 pts 90-day repeat rate; protect margin.
Scoring anchors: Impact scores tied to expected conversion/retention lift; Confidence based on prior tests and analytics; Ease based on engineering/design scope and dependencies.
Shortlisted ideas and ICE scores (average formula):
- One-page checkout + Shop Pay/Apple Pay: Impact 8, Confidence 7, Ease 6 → ICE 7.0
- Upfront shipping/returns clarity on cart: Impact 6, Confidence 8, Ease 8 → ICE 7.3
- Size & fit quiz on PDP (mobile-first): Impact 6, Confidence 6, Ease 5 → ICE 5.7
- Free shipping threshold test ($75→$60): Impact 5, Confidence 6, Ease 9 → ICE 6.7 (guardrail: margin)
- Post-purchase how-to-care emails to reduce returns: Impact 4, Confidence 7, Ease 9 → ICE 6.7
- Referral program (double-sided): Impact 5, Confidence 4, Ease 6 → ICE 5.0
Plan: Sprint 1 shipped shipping/returns clarity (copy + design), one-page checkout with accelerated payments, and a small shipping-threshold pilot in one region. Sprint 2 added the fit quiz and post-purchase care series.
Outcomes (8 weeks):
- Checkout conversion +420 bps; abandonment −11%.
- Cart-to-checkout click-through +260 bps after shipping clarity.
- Fit quiz users converted +310 bps vs. control; return rate −8% in quiz cohort.
- Post-purchase care series cut “care-related” returns by 14%; 90-day repeat purchase +2.9 pts for engaged cohort.
- Shipping-threshold pilot boosted AOV +6% but compressed margin; limited rollout with tighter guardrails.
Learning: Pre-ICE estimates for accelerated payments underestimated impact on mobile. Confidence rose for checkout UX; the team increased weighting on that class of ideas for the next cycle and deprioritized the referral program until more evidence emerged.
7. Strengths and Limitations
Strengths
- Speed and simplicity: Easy to teach and adopt; supports weekly prioritization without analysis paralysis.
- Cross-functional alignment: A shared scoring language that bridges product, design, engineering, analytics, and marketing.
- Evidence-friendly: “Confidence” explicitly rewards ideas backed by data rather than opinion.
- Portfolio thinking: Encourages a mix of quick wins (high Ease), big bets (high Impact), and learning bets (raise Confidence).
Limitations
- Subjectivity: Without rubrics and calibration, scores reflect the loudest voice in the room.
- Coarse economics: ICE is not a substitute for LTV/CAC analysis where stakes are high.
- Ignores dependencies by default: Raw scores can over-rank items blocked by other work; you must adjust for sequencing.
- Gaming risk: Teams can inflate scores to win resources; transparent rationale and post-mortems are essential.
8. Common Pitfalls (and How to Avoid Them)
- Vague Impact definitions
What goes wrong: Impact becomes a popularity contest.
Avoid: Tie Impact to a single target metric and concrete effect sizes; use historical baselines for anchors. - Overconfidence without evidence
What goes wrong: High-ICE ideas underperform.
Avoid: Define Confidence anchors; penalize weak evidence; favor replication and triangulation. - Ignoring Ease beyond engineering
What goes wrong: Surprises in compliance, operations, or partner approvals derail timelines.
Avoid: Include design/QA/ops/compliance in Ease; consider lead times and change management. - Not accounting for dependencies
What goes wrong: High-scoring items stall.
Avoid: Flag blocked items; maintain a “ready” subset; use a simple RAG (red/amber/green) gate on feasibility this sprint. - One-time scoring
What goes wrong: Scores go stale; context changes.
Avoid: Re-score monthly or when objectives shift; retire or archive ideas older than a quarter without owner. - Never calibrating with outcomes
What goes wrong: Bias persists; ICE loses credibility.
Avoid: Quarterly “forecast vs. actual” review by idea class; adjust rubrics and share learnings. - Using multiplication without guardrails
What goes wrong: Outliers dominate; small errors explode.
Avoid: Prefer averaging; if multiplying, cap ranges (1–5), normalize, and sanity check ranks.
9. How ICE Relates to Other Frameworks
- RICE (Reach, Impact, Confidence, Effort): RICE adds Reach and uses Effort instead of Ease. It’s better when audience size varies significantly or when you need a more granular view of scope. ICE is faster; RICE is more precise.
- PIE (Potential, Importance, Ease) for CRO: Similar spirit; “Potential” ≈ Impact; “Importance” leans on page traffic/value; “Ease” is shared. CRO teams often use PIE for site testing; ICE is broader for product and growth.
- WSJF (Weighted Shortest Job First): A scaled agile method that prioritizes by (Cost of Delay ÷ Job Size). Use WSJF for large portfolios and when you can quantify cost of delay; ICE is a lighter alternative.
- Growth Hacking Loop (Ideate–Prioritize–Test–Analyze): ICE is the “Prioritize” step. Use ICE weekly to decide what to test, then feed results back to refine scoring.
- North Star Metric and HEART: Anchor Impact to your North Star or HEART metrics (Task Success, Retention, etc.). ICE ensures your picks ladder up to user and business outcomes.
- Lean Analytics Stages: Let stage determine Impact’s target (e.g., Stickiness → retention). ICE then ranks candidates within the current stage’s focus.
10. Key Takeaways
- ICE (Impact, Confidence, Ease) is a lightweight, high-velocity way to rank ideas and focus execution on what matters now.
- Impact must be tied to a specific outcome; Confidence should reflect evidence quality; Ease must include effort, dependencies, and risk.
- Use a simple formula (average) and clear rubrics; score independently, reconcile quickly, and keep a balanced portfolio of bets.
- Revisit scores regularly and calibrate with actual results to reduce bias and improve forecasting.
- Use ICE for sprint-level decisions; escalate to RICE/WSJF and full business cases for big bets with material economic or technical implications.
11. FAQs About the ICE Prioritization Framework
How do we define Impact credibly?
Anchor Impact to one target metric and a reference class. Use historical baselines (e.g., past checkout experiments) and external benchmarks where available. Express Impact as a relative lift range (e.g., 2–4%) mapped to score anchors. Document the rationale in one sentence.
Should we average or multiply the scores?
Most teams should average (ICE = (I + C + E)/3) for stability and interpretability. Multiplication amplifies differences but can be noisy and gameable. If you multiply, cap scales (1–5), normalize, and sanity check the ranking.
How is ICE different from RICE?
RICE adds Reach (how many users are affected) and uses Effort instead of Ease; it’s better when audience size varies widely between ideas (e.g., a niche feature vs. sitewide change). ICE is faster and sufficient when reach is similar across ideas or when speed is paramount.
How often should we re-score ideas?
Re-score monthly, at the start of each planning cycle, or when objectives change. Also re-score after learning that changes Confidence or Ease (e.g., a dependency clears). Archive or refresh items older than a quarter.
Can small teams or early-stage startups use ICE?
Yes—ICE shines with small teams. Keep rubrics simple, score in under an hour, and move. As you scale, add RICE or WSJF where greater precision is warranted.
How do we prevent gaming or bias?
Score independently, reconcile in a short session, record rationale, and compare forecasts vs. actuals quarterly. Rotate facilitators, and use rubrics with anchors. Limit changes to weights and formulas to once per quarter.
What if high-ICE items are blocked by dependencies?
Flag blocked items as “not ready,” and promote the next best ready items. Maintain a “quick wins” lane for high-Ease items and a “big bets” lane for high-Impact items with clear paths to unblock.
How do we use ICE with economics (LTV/CAC, payback)?
For sprint-level decisions, ICE is sufficient. For initiatives with material spend or risk, pair ICE with a lightweight business case: projected incremental margin, impact on LTV/CAC, and payback. Let ICE select candidates; let economics decide investment depth.
