

1. What Is the Lean Analytics Stages Framework (Empathy–Stickiness–Virality–Revenue–Scale)?
The Lean Analytics Stages framework is a staged approach to building and growing digital products. It sequences the major questions a venture should answer—and the metrics that matter most—across five phases: Empathy, Stickiness, Virality, Revenue, and Scale. At each stage, you focus on one primary objective and a small set of metrics, graduate when you meet thresholds, and only then move to the next stage.
In digital, ecommerce, growth, and product work, this framework prevents premature optimization. It keeps teams from “pouring fuel on a leaky bucket” by validating customer pain (Empathy), proving retention (Stickiness), leveraging organic growth (Virality) where relevant, validating unit economics (Revenue), and only then scaling operations and channels (Scale). It pairs well with a “one metric that matters” (OMTM) discipline and an experiment-led cadence.
Executives and consultants use it to align product, engineering, marketing, and finance on what success looks like right now—so resources and decisions are stage-appropriate and economically sound.
2. Origin and Background
The framework was popularized in the book “Lean Analytics: Use Data to Build a Better Startup Faster” (2013) by Alistair Croll and Benjamin Yoskovitz. It extends Lean Startup ideas (hypothesis-driven validation; Build–Measure–Learn) by defining a sequence of growth stages and the analytics focus for each. The authors emphasized picking an OMTM per stage, graduating based on evidence, and avoiding vanity metrics.
Why it was created: Early-stage teams often spread attention across dozens of KPIs and channels before they’ve validated core assumptions. Lean Analytics imposes focus—one stage, one primary objective, and a tight KPI set—so each constraint is addressed in order of leverage.
How it spread: Through startup accelerators, product/growth playbooks, and analytics communities. Practitioners adapted stage gates and thresholds to different models (SaaS, marketplaces, consumer apps), but the stage logic remains consistent.
3. How the Lean Analytics Stages Framework Works
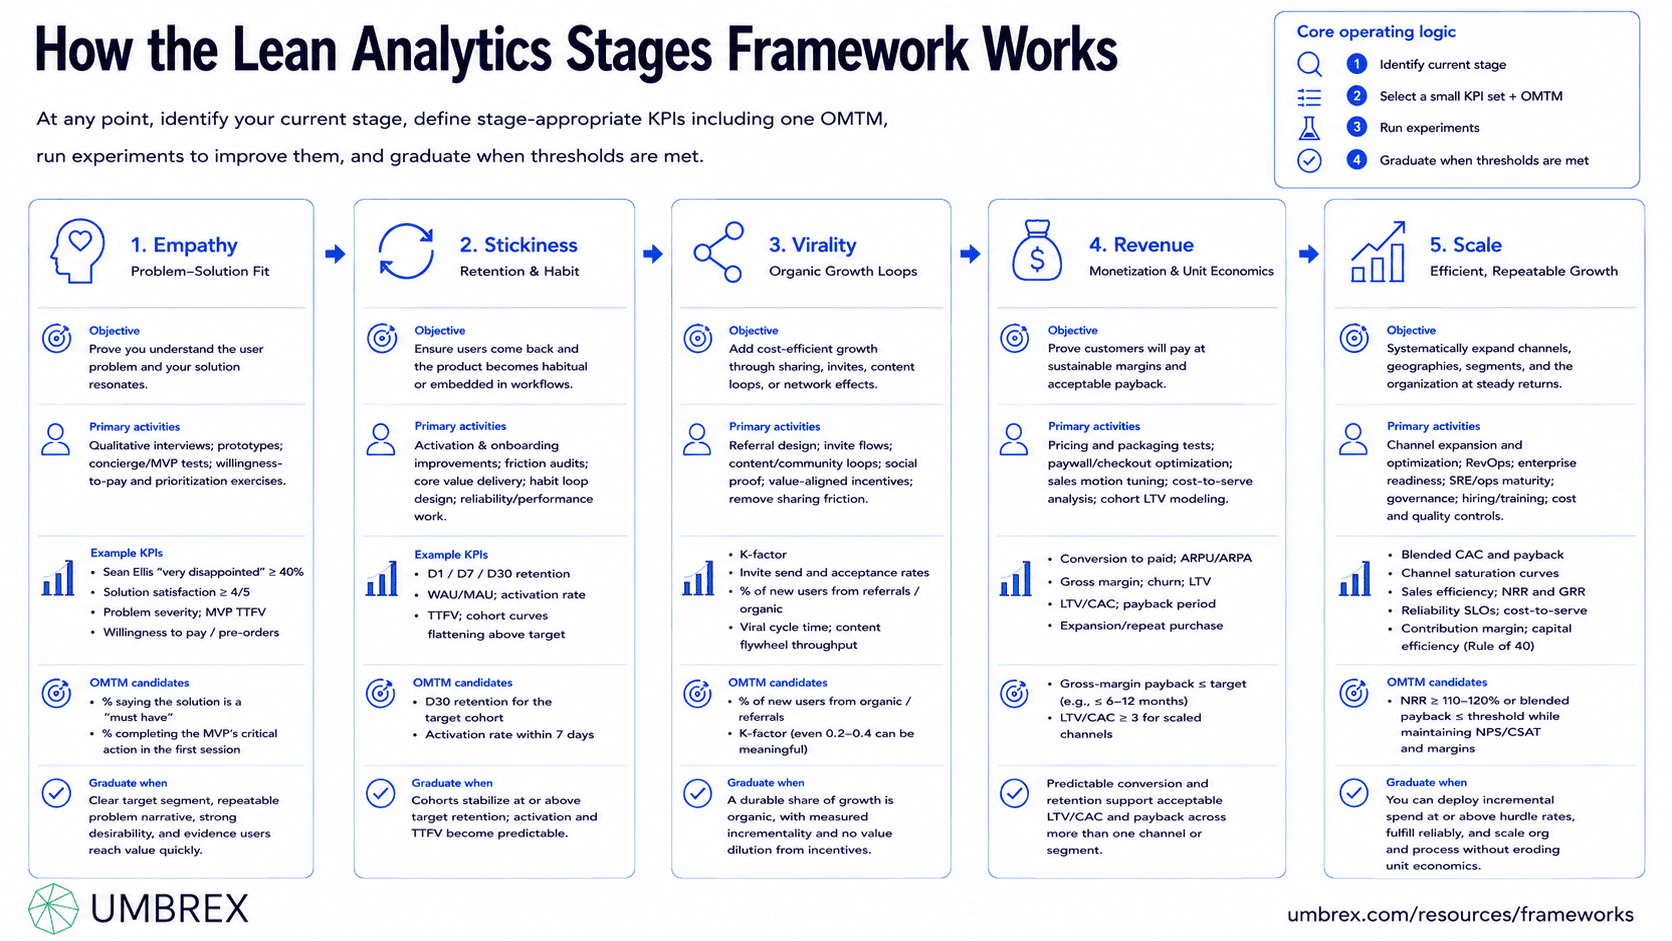
At any point, you identify your current stage, define a small set of stage-appropriate KPIs (including an OMTM), run experiments to improve them, and graduate when thresholds are met. The stages are:
Stage 1: Empathy (Problem–Solution Fit)
- Objective: Prove you deeply understand the user’s problem and that your solution resonates.
- Primary activities: Qualitative interviews, lightweight prototypes, concierge/MVP tests, willingness-to-pay and prioritization exercises.
- Example KPIs: “Very disappointed” score (Sean Ellis test ≥ 40% among target users), solution satisfaction (e.g., ≥ 4/5), qualitative problem severity, time-to-first-value (TTFV) for MVP, explicit willingness to pay or preorders.
- OMTM candidates: % of target users who say the solution is a “must have,” or % completing MVP’s critical action in first session.
- Graduate when: Clear target segment, repeatable problem narrative, strong desirability signals, and evidence users achieve value quickly with your MVP.
Stage 2: Stickiness (Retention and Habit)
- Objective: Ensure users come back—your product is habit-forming or embedded in workflows.
- Primary activities: Activation and onboarding improvements, friction audits, core value delivery, habit loop design, reliability/performance work.
- Example KPIs: D1/D7/D30 retention, WAU/MAU (stickiness), activation rate (reach “aha” milestone), TTFV, cohort curves flattening above a target threshold.
- OMTM candidates: D30 retention for the target cohort; activation rate within 7 days.
- Graduate when: Cohorts stabilize at or above target retention (benchmarks vary by category); activation and TTFV are predictable.
Stage 3: Virality (Organic Growth Loops)
- Objective: Add cost-efficient growth through sharing/invites, content loops, or network effects—if your model supports it.
- Primary activities: Referral design, invite flows, content/community loops, social proof, value-aligned incentives, removing friction from sharing.
- Example KPIs: Viral coefficient (K-factor), invite send and acceptance rates, % of new users from referrals/organic, viral cycle time, content SEO flywheel throughput.
- OMTM candidates: % new users from organic/referrals; K-factor (often K ≥ 0.2–0.4 is meaningful even if < 1).
- Graduate when: A durable proportion of growth is organic, with measured incrementality (holdouts) and no value dilution from incentives.
Stage 4: Revenue (Monetization and Unit Economics)
- Objective: Prove customers will pay, at sustainable margins and acceptable payback.
- Primary activities: Pricing/packaging tests, paywall/checkout optimization, sales motion tuning, cost-to-serve analysis, cohort LTV modeling.
- Example KPIs: Conversion to paid, ARPU/ARPA, gross margin, churn (logo and revenue), LTV, LTV/CAC, payback period, expansion/repeat purchase.
- OMTM candidates: Gross-margin payback ≤ target (e.g., ≤ 6–12 months), or LTV/CAC ≥ 3 for scaled channels.
- Graduate when: Predictable conversion and retention support acceptable LTV/CAC and payback, with unit economics validated on more than one channel or segment.
Stage 5: Scale (Efficient, Repeatable Growth)
- Objective: Systematically expand channels, geographies, segments, and the organization at target returns.
- Primary activities: Channel expansion and optimization, revenue operations, enterprise readiness, SRE/ops maturity, governance, hiring/training, cost/quality controls.
- Example KPIs: Blended CAC and payback at target; channel saturation curves; sales efficiency (e.g., Magic Number for SaaS); NRR and GRR; reliability SLOs; cost-to-serve; contribution margin; capital efficiency (Rule of 40 or equivalent).
- OMTM candidates: NRR ≥ 110–120% (SaaS) or blended payback ≤ threshold while maintaining NPS/CSAT and margins.
- Graduate when: You can deploy incremental spend at or above hurdle rates, fulfill reliably, and scale org/process without eroding unit economics.
4. When to Use the Lean Analytics Stages Framework
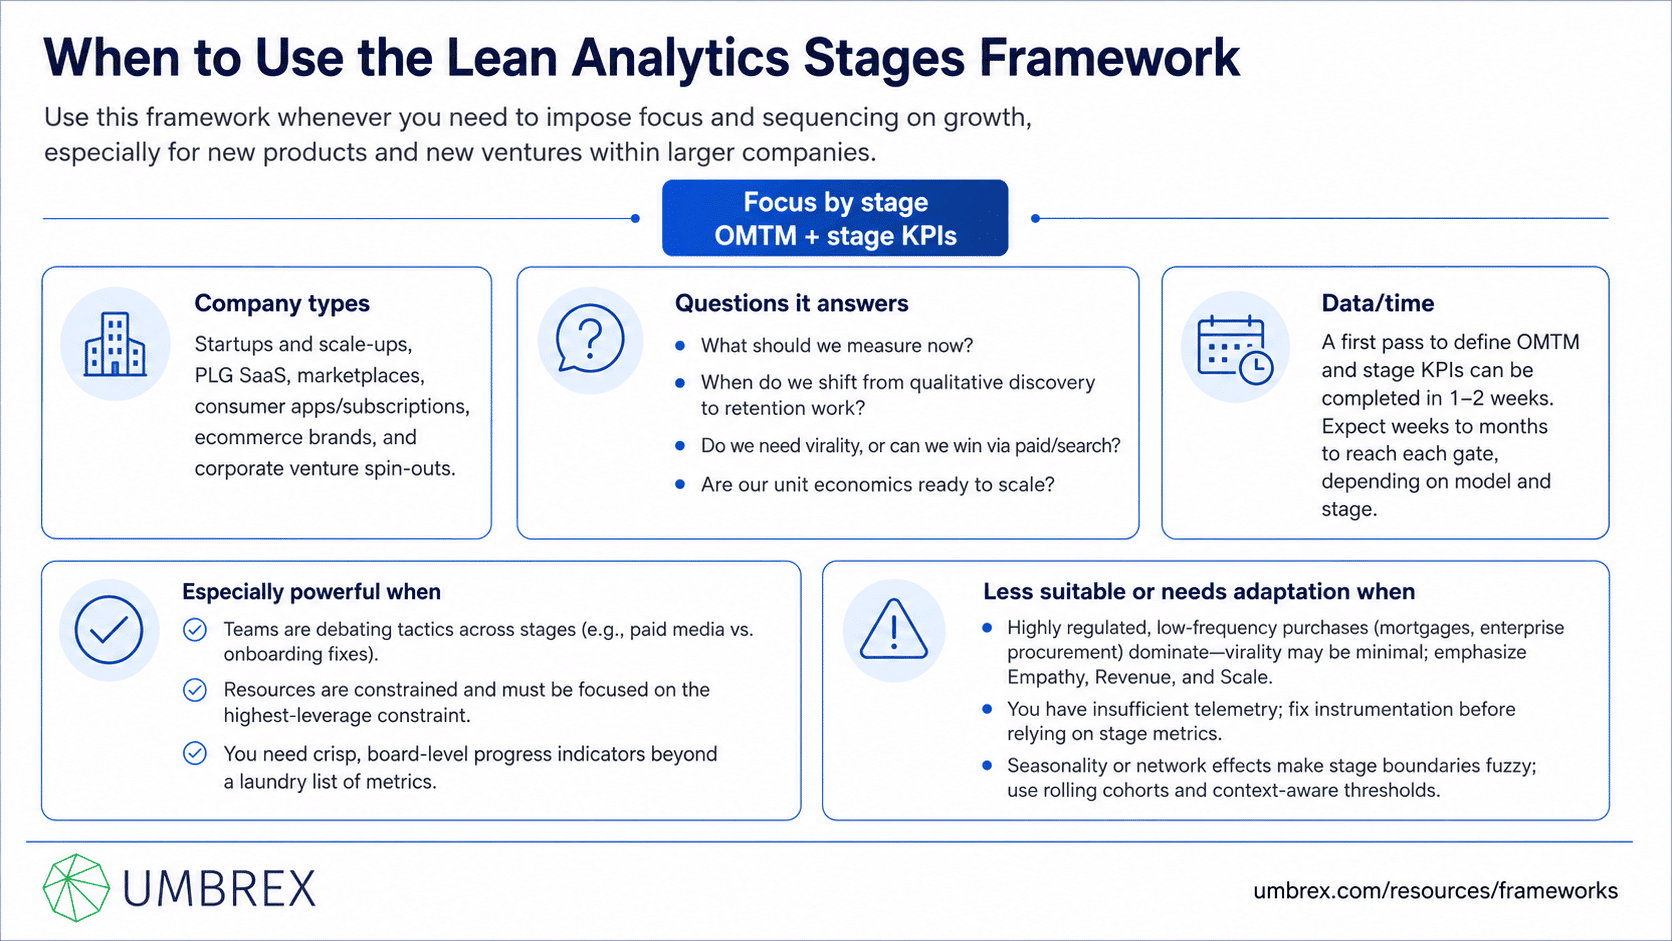
Use this framework whenever you need to impose focus and sequencing on growth, especially for new products and new ventures within larger companies.
- Company types: Startups and scale-ups, PLG SaaS, marketplaces, consumer apps/subscriptions, ecommerce brands, and corporate venture spin-outs.
- Questions it answers: What should we measure now? When do we shift from qualitative discovery to retention work? Do we need virality, or can we win via paid/search? Are our unit economics ready to scale?
- Data/time: A first pass to define OMTM and stage KPIs can be completed in 1–2 weeks. Expect weeks to months to reach each gate, depending on model and stage.
Especially powerful when:
- Teams are debating tactics across stages (e.g., paid media vs. onboarding fixes).
- Resources are constrained and must be focused on the highest-leverage constraint.
- You need crisp, board-level progress indicators beyond a laundry list of metrics.
Less suitable or needs adaptation when:
- Highly regulated, low-frequency purchases (mortgages, enterprise procurement) dominate—virality may be minimal; emphasize Empathy, Revenue, and Scale.
- You have insufficient telemetry; fix instrumentation before relying on stage metrics.
- Seasonality or network effects make stage boundaries fuzzy; use rolling cohorts and context-aware thresholds.
5. How to Apply the Framework: Step-by-Step
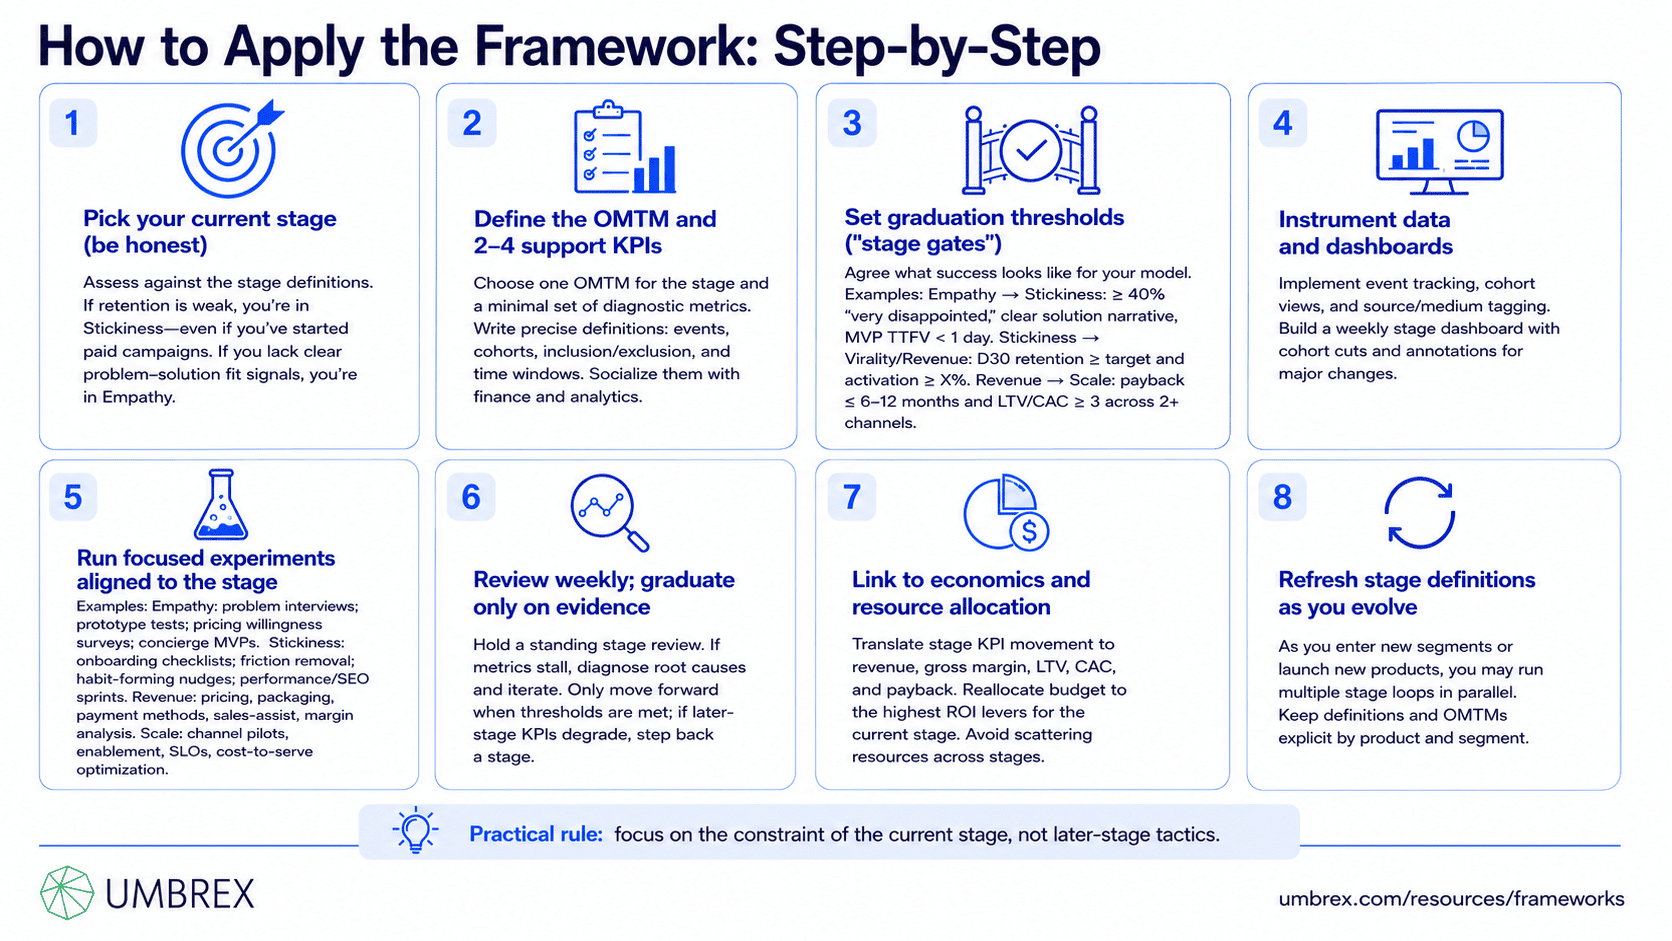
- Pick your current stage (be honest)
Assess against the stage definitions. If retention is weak, you’re in Stickiness—even if you’ve started running paid campaigns. If you lack clear problem–solution fit signals, you’re in Empathy.
- Define the OMTM and 2–4 support KPIs
Choose one OMTM for the stage and a minimal set of diagnostic metrics. Write precise definitions (events, cohorts, inclusion/exclusion, time windows). Socialize them with finance and analytics.
- Set graduation thresholds (“stage gates”)
Agree what success looks like for your model. Examples:
– Empathy → Stickiness: ≥ 40% “very disappointed”, complete solution narrative, and MVP TTFV < 1 day.
– Stickiness → Virality/Revenue: D30 retention ≥ target (e.g., 20–30% for a consumer app; different for SaaS) and activation ≥ X%.
– Revenue → Scale: Payback ≤ 6–12 months (business-dependent) and LTV/CAC ≥ 3 across 2+ channels.
- Instrument data and dashboards
Implement event tracking, cohort views, and source/medium tagging. Build a stage dashboard with weekly cadence, cohort cuts, and annotations for major changes.
- Run focused experiments aligned to the stage
Examples:
– Empathy: Problem interviews; prototype tests; pricing willingness surveys; concierge MVPs.
– Stickiness: Onboarding checklists; friction removal; habit-forming nudges; performance/reliability sprints.
– Virality: Referral design; invite triggers; double-sided incentives; content/SEO loops; share UX.
– Revenue: Price and packaging tests; free-to-paid flows; payment methods; sales-assist plays; margin analysis.
– Scale: Channel expansion pilots with holdouts; sales capacity and enablement; reliability SLOs; cost-to-serve optimization.
- Review weekly; graduate only on evidence
Hold a standing stage review. If metrics stall, diagnose root causes and iterate. Only move forward when thresholds are met; if a later-stage KPI degrades, be willing to step back a stage.
- Link to economics and resource allocation
Translate stage KPI movement to revenue, gross margin, LTV, CAC, and payback. Reallocate budget to the current stage’s highest-ROI levers; avoid scattering resources across stages.
- Refresh stage definitions as you evolve
As you enter new segments or launch new products, you may run multiple stage loops in parallel. Keep definitions and OMTMs explicit per product/segment.
6. Example: Lean Analytics Stages in Action
Context: “SnapBudget,” a consumer finance app, had 150k installs but weak retention and inconsistent subscription conversion. Marketing pushed for more paid spend; finance questioned payback. The CEO asked for a stage-focused plan.
Stage assessment: Empathy signals were strong (users rated clarity highly), but D30 retention was 16% and subscription conversion 2.8%. The team declared Stickiness as the current stage (not Revenue).
Stickiness plan (8 weeks):
- OMTM: D30 retention for new cohorts.
- Supporting KPIs: Activation within 72 hours (connect bank + categorize 10 transactions), TTFV (first insight shown), weekly active days.
- Experiments: Bank-connect flow simplification; auto-categorization to 80%; “Today’s insight” card; weekly bill alerts; onboarding checklist; notification frequency caps.
Results: Activation rose from 41% to 58%; TTFV dropped from 2.8 days to same-day for 64% of new users; D30 retention climbed to 24% across three cohorts.
Virality plan (4 weeks) (secondary, given improved stickiness): streamlined referral (double-sided month free), shareable “savings this week” cards, and a billing reminder share option. % of new users from referrals rose from 5% to 11%; K-factor ~0.28.
Revenue plan (6 weeks):
- OMTM: Gross-margin payback ≤ 6 months in the top two channels.
- Experiments: Reframed paywall (value-led benefits, annual discount); added Apple Pay; introduced a mid-tier plan; 14-day grace for bank-sync failures.
Results: Trial-to-paid conversion improved to 5.1%; refunds dropped 18% due to clearer expectations; blended payback fell from 9.2 to 6.2 months. With retention sustained, the company moved measured spend into Scale pilots across search and influencer channels, maintaining payback < 6 months.
7. Strengths and Limitations
Strengths
- Focus: One primary objective at a time reduces noise and misalignment.
- Sequencing: Prevents scaling before retention or unit economics are proven.
- Metric discipline: Encourages OMTM and cohort-based analytics; ties work to economics.
- Adaptable: Works across models; thresholds can be tuned to category benchmarks.
Limitations
- Not strictly linear: Real life loops; you may advance and retreat between stages.
- Virality isn’t universal: Some businesses won’t benefit materially; forcing it can distract.
- Threshold ambiguity: Stage gates need context; copying benchmarks blindly can mislead.
- Multi-product complexity: Running multiple stage loops in parallel requires strong governance.
8. Common Pitfalls (and How to Avoid Them)
- Premature scaling
What goes wrong: High CAC with weak retention; payback balloons.
Avoid: Don’t move to Scale until Stickiness and Revenue gates are met; test spend with holdouts.
- Too many KPIs per stage
What goes wrong: Team loses focus; dashboards sprawl.
Avoid: One OMTM and 2–4 diagnostic metrics; prune quarterly.
- Chasing virality that doesn’t fit
What goes wrong: Low-quality users; incentive costs; compliance risk.
Avoid: Use incrementality tests; if K-factor stays low and CAC is tolerable, redirect effort to retention/revenue.
- Ignoring cohort analysis
What goes wrong: Averages mask segment issues; false positives.
Avoid: Always view activation/retention/revenue by cohort (signup month, channel, plan, device).
- Ambiguous graduation criteria
What goes wrong: Endless debate; stage drift.
Avoid: Write explicit gates with numeric thresholds and dates; agree with leadership upfront.
- Data debt
What goes wrong: Decisions on bad telemetry; inconsistent definitions.
Avoid: Maintain a tracking plan; version-control metrics; audit event quality.
9. How Lean Analytics Stages Relate to Other Frameworks
- Lean Startup (Build–Measure–Learn): Lean Analytics operationalizes what to measure and when; you iterate within each stage until gates are met.
- AARRR (Pirate Metrics): Stages map to funnel priorities: Empathy → qualitative pre-AARRR; Stickiness → Activation/Retention; Virality → Referral; Revenue → Revenue; Scale → Acquisition efficiency and systemization.
- North Star Metric: NSM gives a long-term value signal; Lean Analytics provides stage-specific OMTMs that ladder up to the NSM.
- HEART: Use HEART to select user-centered metrics within stages (e.g., Task Success for Stickiness; Happiness as a guardrail in Revenue/Scale).
- Growth Hacking Loop (Ideate–Prioritize–Test–Analyze): The loop is your execution engine; Lean Analytics decides which stage’s hypotheses you prioritize.
- RACE / See–Think–Do–Care: Planning lenses across the journey; Lean Analytics decides the current stage emphasis (e.g., “Care/Stickiness before See/Reach”).
- Growth Loops: Virality formalizes discovery and tune-up of loops (referral, content, marketplace) before scaling them.
10. Key Takeaways
- Lean Analytics Stages sequence your focus: Empathy → Stickiness → Virality → Revenue → Scale.
- Adopt an OMTM per stage and graduate only when thresholds are met; avoid scaling before retention and unit economics are proven.
- Use cohort analytics and experimentation to improve stage KPIs; link improvements to LTV, CAC, and payback.
- Virality is optional; don’t force it if your model doesn’t benefit materially.
- Stages aren’t strictly linear—be ready to step back if later-stage performance reveals earlier-stage gaps.
11. FAQs About the Lean Analytics Stages Framework
Do we always need a Virality stage?
No. Many models (e.g., enterprise SaaS, regulated fintech) won’t gain much from virality. If incrementality tests show low impact or adverse selection, focus on Stickiness and Revenue, and treat organic growth as a bonus rather than a requirement.
How long does each stage take?
It varies. Empathy can be weeks; Stickiness often takes multiple cohorts (1–3 months). Revenue validation can take a quarter or more, especially in B2B. Scale is ongoing. The point isn’t speed—it’s avoiding premature progression.
What’s the difference between Lean Analytics and AARRR?
AARRR provides a funnel of behaviors to measure; Lean Analytics sequences which part of that funnel you should focus on and sets graduation criteria. They’re complementary.
How do we pick the OMTM?
Choose the metric most predictive of stage success and long-term value. In Stickiness, D30 retention may be best; in Revenue, payback or LTV/CAC; in Empathy, % “very disappointed” or TTFV for MVP users. Keep it simple and actionable.
How does this apply to B2B enterprise?
Empathy involves deep stakeholder interviews; Stickiness centers on deployment and active-seat retention; Virality may mean internal expansion (land-and-expand) rather than referrals; Revenue hinges on pricing, sales cycle, and expansion; Scale focuses on sales efficiency, implementation capacity, and NRR.
What guardrails should we track across stages?
Happiness (CSAT/NPS), complaint/refund rates, reliability (crashes/latency), and margin. These prevent stage gains that harm long-term trust or economics.
