

1. What Is the Pirate Metrics / AARRR Funnel (Acquisition, Activation, Retention, Referral, Revenue)?
The Pirate Metrics (AARRR) Funnel is a simple, data-driven framework for measuring and improving digital product growth. AARRR stands for Acquisition, Activation, Retention, Referral, and Revenue. It breaks the user journey into five stages and anchors each stage with a small set of metrics that indicate whether your product is actually creating value and compounding growth.
In digital, ecommerce, growth, and product contexts, AARRR gives teams a common language to diagnose bottlenecks (e.g., “strong Acquisition, weak Activation”), prioritize experiments, and tie improvements to unit economics (CAC, LTV, payback). It is channel-agnostic and works for B2C, B2B, PLG (product-led growth), and ecommerce—as long as you define each stage concretely for your product.
The appeal is clarity. Rather than dozens of dashboards, leadership and teams focus on the few signals that matter across the lifecycle—and on the compounding effects when successive stages are healthy.
2. Origin and Background
The AARRR model was coined by Dave McClure (entrepreneur and founder of 500 Startups) around 2007–2010. It popularized a pragmatic approach to startup analytics, pushing teams to instrument behavior, run experiments, and optimize the funnel end to end. The “Pirate Metrics” nickname comes from pronouncing AARRR like a pirate’s “Arrr.”
Why it was created: to counter vanity metrics (pageviews, downloads) and encourage rigorous, behavior-based metrics that correlate with product-market fit and sustainable growth. It spread widely through startup accelerators, growth blogs, and PLG playbooks, and remains a staple for digital growth planning.
3. How the AARRR Funnel Works
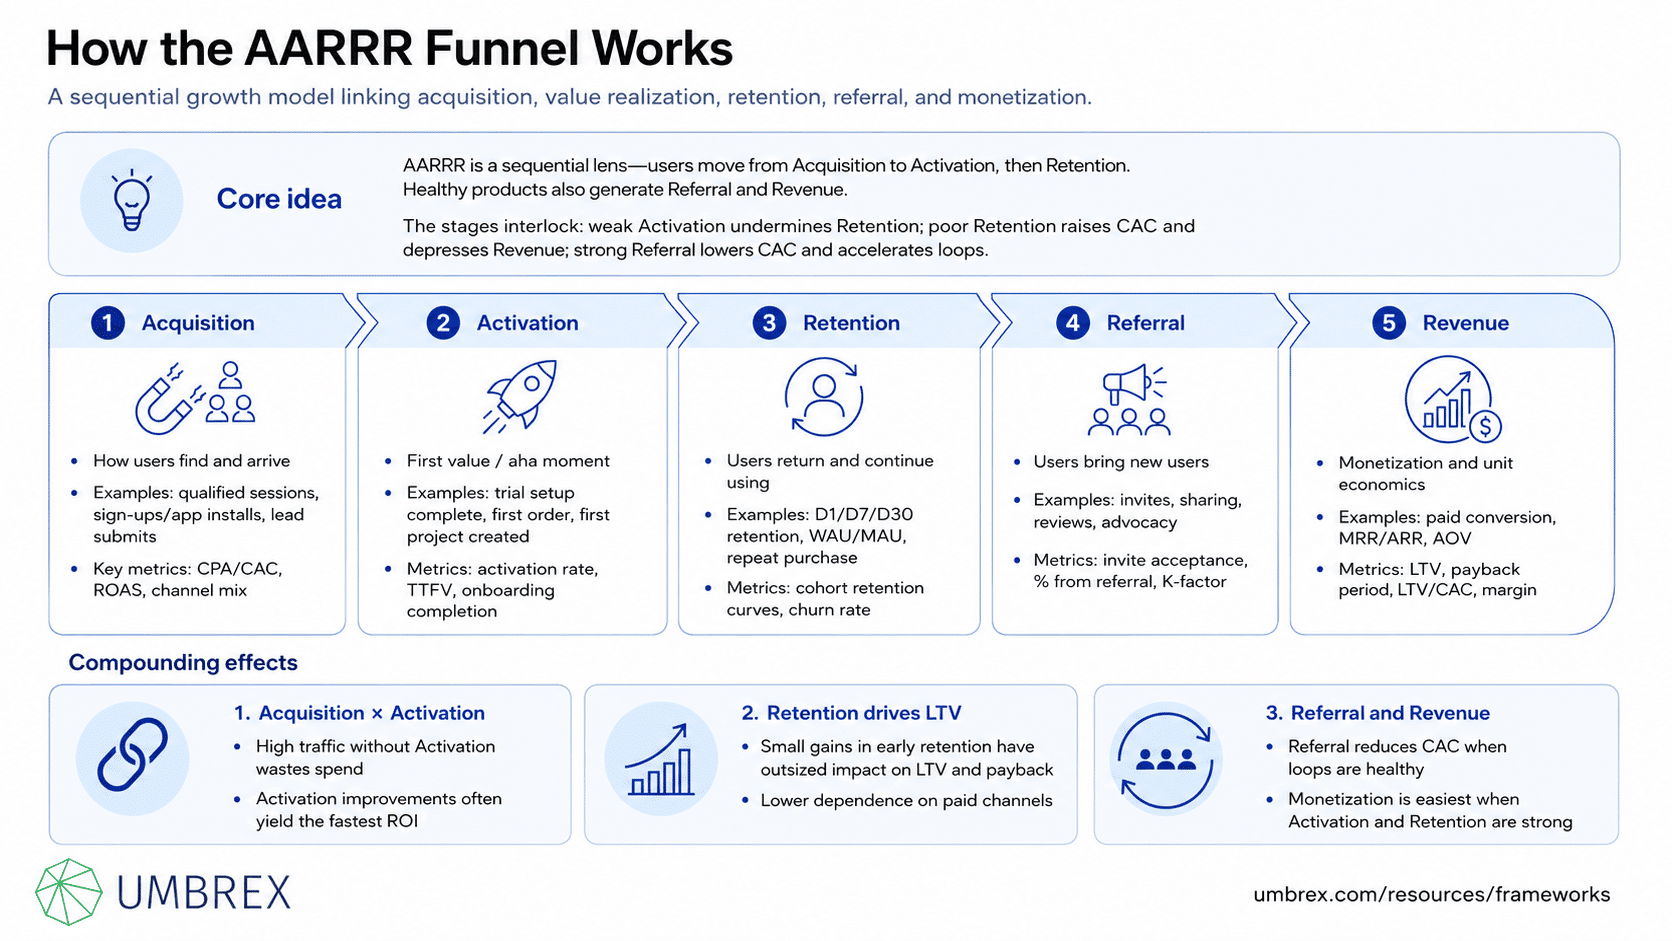
AARRR is a sequential lens—users move from Acquisition to Activation, then Retention. Healthy products also generate Referral and Revenue. The stages interlock: weak Activation undermines Retention; poor Retention raises CAC and depresses Revenue; strong Referral lowers CAC and accelerates loops.
Definitions and example metrics
- Acquisition: How users find and arrive at your product (and opt in to be contacted).
- Examples: Qualified sessions/users, sign-ups or app installs, lead form submits, cost per acquisition (CPA/CAC), channel mix and ROAS.
- Notes: Focus on qualified acquisition (e.g., cost per engaged visit, cost per sign-up that reaches Activation), not raw traffic.
- Activation: The first value moment—users experience the “aha” and complete a meaningful action.
- Examples: Trial setup completed, first order placed, “created first project and invited a teammate,” “logged a workout and saved a plan.”
- Metrics: Activation rate (% of acquired users who reach the milestone), time-to-first-value (TTFV), onboarding completion.
- Notes: Define a crisp, observable milestone that predicts Retention and Revenue.
- Retention: Users come back and use the product again within an expected window; churn is the inverse.
- Examples: D1/D7/D30 retention, WAU/MAU (stickiness), cohort retention curves, churn rate, active subscriber ratio, repeat purchase rate.
- Notes: Measure by cohort (signup month, plan, channel), not aggregate averages.
- Referral: Existing users drive new users via sharing, invites, or advocacy.
- Examples: Invite send rate, invite acceptance rate, % of new users from referrals, K‑factor (viral coefficient), review and NPS-driven signups.
- Notes: Authentic value plus a smooth referral path beats heavy incentives that attract low-quality users.
- Revenue: Monetization and unit economics.
- Examples: Conversion to paid, ARPU/ARPPU, MRR/ARR, AOV and margin, expansion revenue, LTV, payback period, LTV/CAC.
- Notes: Track both top-line and contribution margin; measure price/packaging experiments with cohort economics.
Core logic and compounding effects
- Acquisition × Activation: High traffic without Activation wastes spend; Activation improvements often yield the fastest ROI.
- Retention drives LTV: Small gains in early retention have outsized impact on LTV and payback, reducing dependence on paid channels.
- Referral reduces CAC: Healthy Referral loops improve quality and cost efficiency; measure incrementality versus organic trends.
- Revenue follows value: Monetization is easiest when Activation and Retention are strong; forcing early monetization can harm long-term value.
4. When to Use AARRR
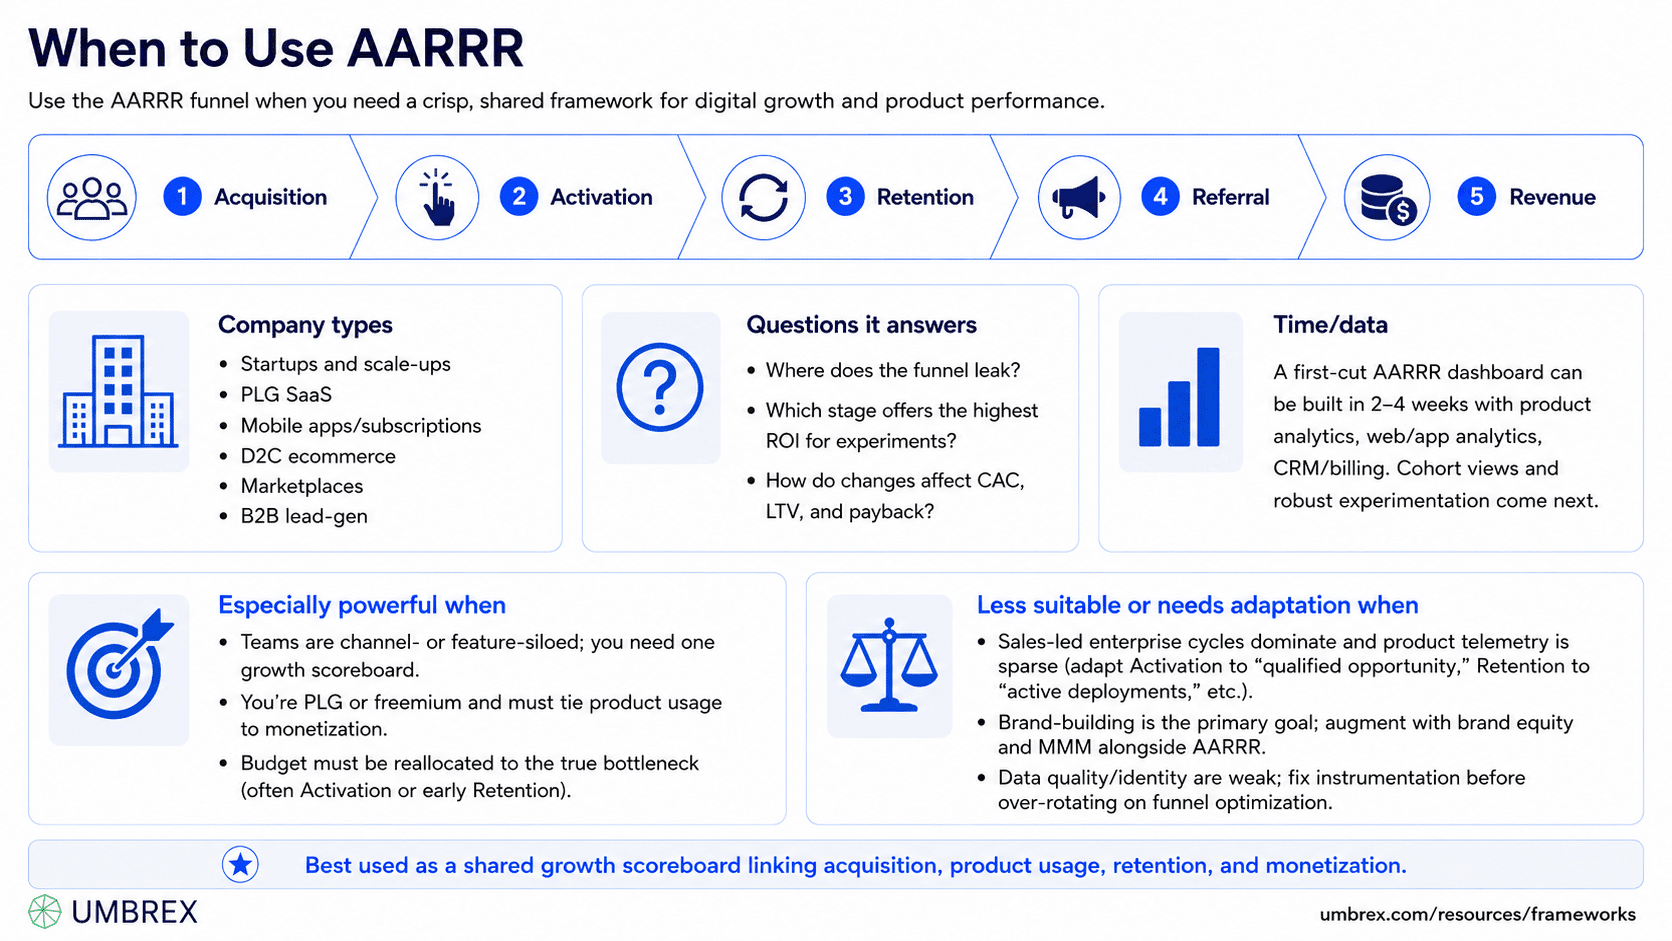
Use the AARRR funnel when you need a crisp, shared framework for digital growth and product performance.
- Company types: Startups and scale-ups, PLG SaaS, mobile apps/subscriptions, D2C ecommerce, marketplaces, and B2B lead-gen.
- Questions it answers: Where does the funnel leak? Which stage offers the highest ROI for experiments? How do changes affect CAC, LTV, and payback?
- Time/data: A first-cut AARRR dashboard can be built in 2–4 weeks with product analytics, web/app analytics, CRM/billing. Cohort views and robust experimentation come next.
Especially powerful when:
- Teams are channel- or feature-siloed; you need one growth scoreboard.
- You’re PLG or freemium and must tie product usage to monetization.
- Budget must be reallocated to the true bottleneck (often Activation or early Retention).
Less suitable or needs adaptation when:
- Sales-led enterprise cycles dominate and product telemetry is sparse (adapt Activation to “qualified opportunity,” Retention to “active deployments,” etc.).
- Brand-building is the primary goal; augment with brand equity and MMM alongside AARRR.
- Data quality/identity are weak; fix instrumentation before over-rotating on funnel optimization.
5. How to Apply AARRR: Step-by-Step
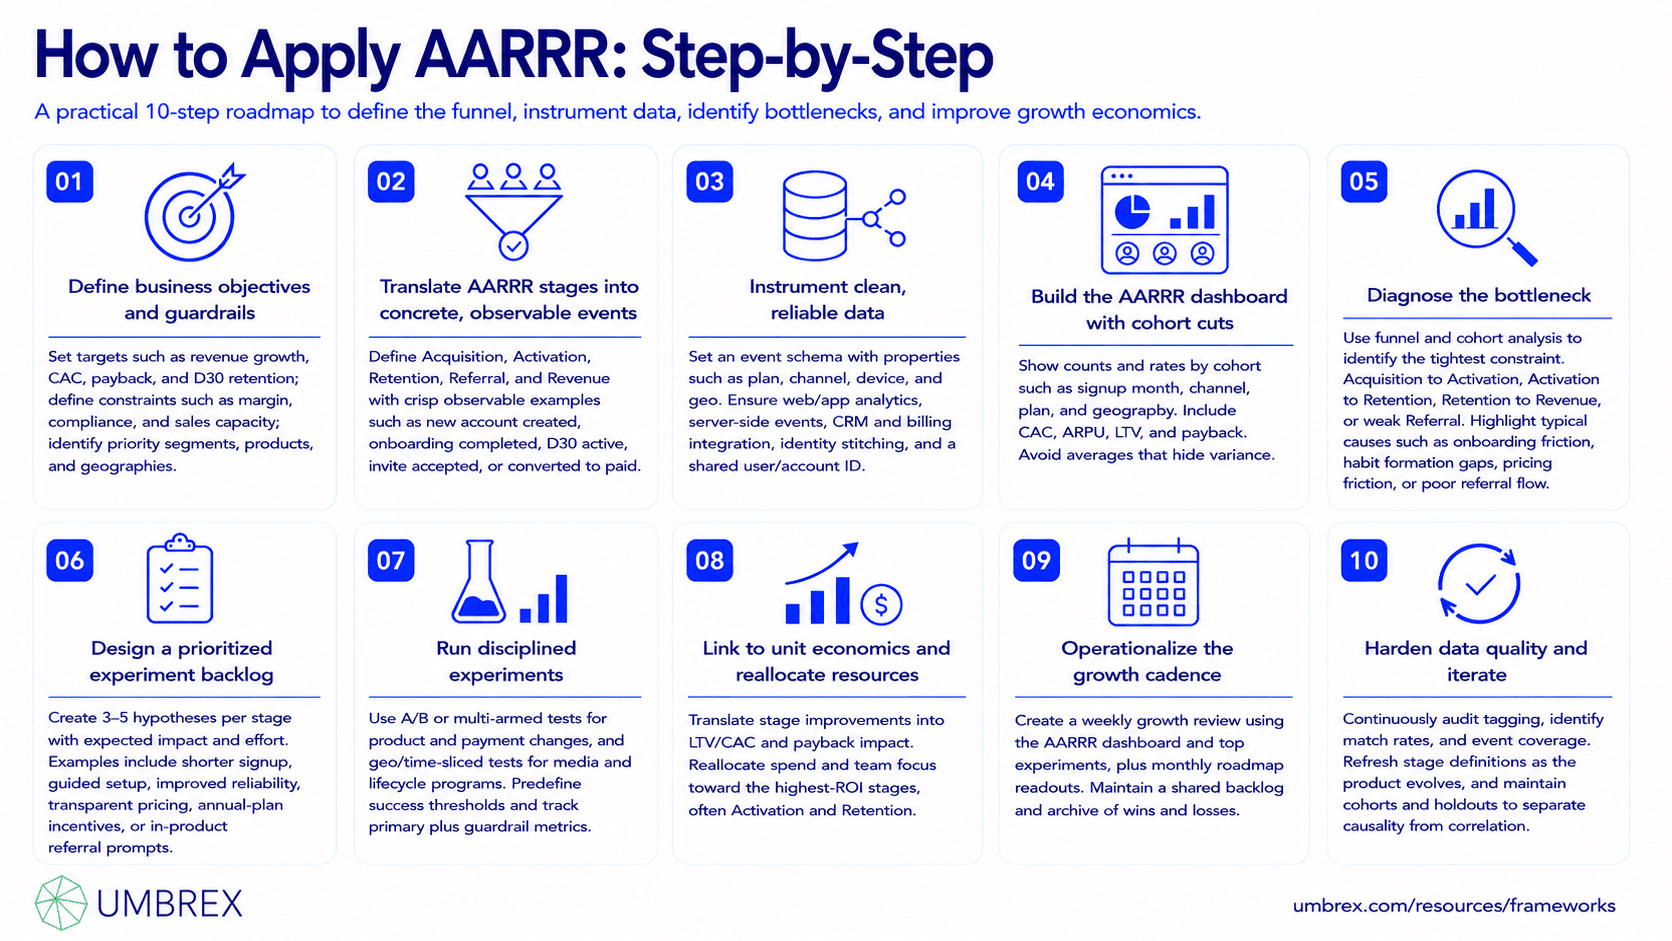
- Define business objectives and guardrails
Set targets (e.g., +20% revenue, CAC < $90, payback < 6 months, D30 retention +5 pts) and constraints (margin, compliance, sales capacity). Identify priority segments/products/geos.
- Translate AARRR stages into concrete, observable events
Write crisp definitions for each stage. Examples:
– Acquisition: “New account created” or “qualified visit (≥30s + 2 key events).”
– Activation: “Completed onboarding checklist” or “created first doc + invited a teammate” (B2B) or “placed first order” (ecom).
– Retention: “Used core feature ≥1x in week 2 and week 4,” “D30 active,” or “repeat purchase within 45 days.”
– Referral: “Invite sent,” “invite accepted,” “review posted with verified purchase.”
– Revenue: “Converted to paid,” “MRR ≥ $X,” “AOV ≥ $Y,” “expansion purchase.”
- Instrument clean, reliable data
Define an event schema with properties (plan, channel, device, geo). Ensure:
– Web/app analytics + server-side events.
– CRM/billing integration for paid conversion, refunds, chargebacks.
– Identity stitching for cross-device and channel attribution (first-party, consented).
– A shared user/account ID for cohort analysis.
- Build the AARRR dashboard with cohort cuts
For each stage, show rates and counts by cohort (signup month, channel, plan, geo). Include economics (CAC, ARPU, LTV, payback). Avoid aggregate averages that hide variance.
- Diagnose the bottleneck
Use funnel and cohort analysis to identify the tightest constraint:
– High Acquisition, low Activation → onboarding/“first value” problem.
– Decent Activation, poor Retention → habit formation, core value, or expectation mismatch.
– Good Retention, weak Revenue → pricing/packaging, paywall friction, or poor sales assist.
– Weak Referral → no obvious shareable value or clunky referral flow.
- Design a prioritized experiment backlog
Create 3–5 hypotheses per stage with expected impact and effort. Examples:
– Activation: shorten signup; guided setup; templates; first-use checklist; contextual tips; success milestone emails/push.
– Retention: improve core speed/reliability; reduce effort; habit loops (reminders tied to user goals); education for underused features.
– Revenue: one-page checkout/paywall; transparent pricing; add payment options; annual plan incentives; price tests with guardrails.
– Referral: in-product share triggers after a success; double-sided incentive; frictionless invite flow; post‑NPS referral prompts.
- Run disciplined experiments
Use A/B or multi-armed tests for product and paywall changes; geo/time-sliced tests for media and lifecycle programs. Pre-define success thresholds (e.g., Activation +300 bps with no Retention drop; payback ≤ X months). Track primary and guardrail metrics.
- Link to unit economics and reallocate resources
Translate stage lifts to LTV/CAC and payback. Reallocate spend and team focus to high-ROI stages (often Activation and Retention). Avoid “do everything a little bit” dilution.
- Operationalize the growth cadence
Weekly growth review (AARRR dashboard + top experiments); monthly roadmap readouts; publish learnings. Maintain a shared backlog and archive of wins/losses to avoid relearning.
- Harden data quality and iterate
Continuously audit tagging, identity match rates, and event coverage. Refresh stage definitions as product evolves. Keep cohorts and holdouts to separate causality from correlation.
6. Example: AARRR in Action
Context: “TaskFlow,” a $40M ARR freemium B2B collaboration app, saw slowing growth. Sign-ups were healthy, but trial-to-activation lagged, and expansion revenue underperformed. CAC was rising on paid channels; referrals were modest.
Baseline (quarterly): Acquisition: +18% sign-ups; Activation (create first project + invite teammate within 7 days): 32%; D30 retention: 23%; % new users via referral: 6%; Conversion to paid (freemium → paid in 30 days): 4.8%; Payback: 9.5 months.
Actions:
- Activation: Simplified signup (SSO), added onboarding templates by role, in-app checklist (“create first project,” “invite teammate,” “complete first task”), and a 10-minute guided walkthrough; success emails tied to milestones.
- Retention: Improved performance for boards with 50+ tasks; introduced weekly recap emails highlighting overdue tasks; enhanced notifications with smart batching.
- Revenue: Reframed paywall with value tiers; added monthly→annual offer at day 14; added Stripe + PayPal; transparent pricing on usage caps; launched a starter plan for small teams.
- Referral: Embedded “share this board” prompts after project completion; double-sided credit for invited teams that became active; NPS-triggered referral asks.
Outcomes (10 weeks, A/B + geo pilots): Activation +8.5 pts (to 40.5%); D30 retention +4 pts; paid conversion +2.1 pts (to 6.9%); annual plan mix rose to 38% of new paid sign-ups; referrals grew to 11% of new sign-ups. Blended CAC −14%; payback improved to 6.8 months. The board approved shifting 15% of paid Acquisition budget to Activation and Referral programs based on superior unit economics.
7. Strengths and Limitations
Strengths
- Clarity: Five stages capture the essential growth levers without drowning in metrics.
- Actionable: Maps directly to experiments that improve conversion, retention, and economics.
- Measurable: Encourages cohort analysis, testing discipline, and LTV/CAC thinking.
- Cross-functional: Aligns marketing, product, data, and (for B2B) sales around one funnel.
Limitations
- Oversimplification risk: Real journeys loop and involve multiple stakeholders; adapt stage definitions to context.
- Strategy gap: AARRR is an instrumentation and execution lens; you still need positioning, JTBD, and product strategy.
- Attribution challenges: Upper-funnel and Referral impact can be undercounted without holdouts and cohort payback.
- Enterprise nuance: For long, sales-led cycles, map Activation/Retention to opportunity and deployment milestones.
8. Common Pitfalls (and How to Avoid Them)
- Vague Activation definition
What goes wrong: You “optimize” to a weak proxy that doesn’t predict Retention/Revenue.
How to avoid: Choose an activation milestone tightly correlated with long-term value; validate via cohort analysis.
- Focusing on aggregates, not cohorts
What goes wrong: Improvements for one segment mask declines in another; false confidence.
How to avoid: Always view AARRR by cohort (signup month, channel, plan) and segment (geo, device).
- Local optimization that harms the system
What goes wrong: Pushy paywalls raise short-term Revenue but hurt Retention and referrals.
How to avoid: Set guardrails; measure downstream impact (90-day retention, refunds, churn).
- Referral fraud or low-quality incentives
What goes wrong: Incentives attract low-intent or fraudulent users; CAC looks good, LTV collapses.
How to avoid: Validate with downstream retention/spend; implement anti-fraud; prefer value-add rewards.
- Data debt and broken instrumentation
What goes wrong: Decisions on bad data; tests misread.
How to avoid: Maintain a tracking plan; audit events; monitor identity match and event loss.
- Too many metrics
What goes wrong: Dashboard sprawl; no focus.
How to avoid: 2–4 KPIs per stage; diagnostics behind them; a single weekly view.
- Benchmark chasing
What goes wrong: Copying generic benchmarks that don’t reflect your category/segment.
How to avoid: Build baselines from your data; compare versus your cohorts and closest peers.
9. How AARRR Relates to Other Frameworks
- RACE (Reach, Act, Convert, Engage): Close mapping: Acquisition ≈ Reach; Activation ≈ Act; Revenue ≈ Convert; Retention/Referral ≈ Engage. Use RACE for go-to-market planning and channel KPIs; use AARRR for product and growth funnel instrumentation.
- See–Think–Do–Care (STDC): Intent-focused lens. See/Think map to Acquisition/Activation; Do to Revenue; Care to Retention/Referral. Use STDC to shape messages by intent; AARRR to measure behavior and economics.
- Growth Loops: Loops describe compounding mechanisms (e.g., content → SEO → users → more content). AARRR provides stage metrics to measure loop throughput and health.
- North Star Metric and HEART: AARRR is a system view; North Star focuses on the single metric that best captures delivered value; HEART (Happiness, Engagement, Adoption, Retention, Task success) adds UX nuance. Use together for balanced product health.
- Customer Lifecycle / CVM: Lifecycle (Acquire–Onboard–Develop–Retain–Win‑Back) and Customer Value Management set enterprise priorities and ROI. AARRR supplies the stage-level KPIs and experiment cadence.
- JTBD and Kano: Use Jobs-to-be-Done to define Activation and Retention levers; Kano to prioritize features that impact Activation (delighters vs. must-haves).
10. Key Takeaways
- Pirate Metrics (AARRR) is a concise framework for measuring and improving digital growth across five stages: Acquisition, Activation, Retention, Referral, Revenue.
- Define each stage concretely for your product; instrument clean events and build cohort-based dashboards tied to unit economics.
- Fix the tightest bottleneck first—often Activation or early Retention—before buying more traffic.
- Run disciplined experiments with guardrails; measure downstream impact on LTV, payback, and churn, not just local stage lifts.
- Use AARRR alongside RACE/STDC for planning, Growth Loops for compounding, and North Star/HEART for product health. Strategy (positioning, JTBD) still matters.
11. FAQs About Pirate Metrics / AARRR
Who created AARRR?
Dave McClure popularized Pirate Metrics (AARRR) around 2007–2010 to give startups a simple, behavior-based analytics model for growth.
What’s the best way to define Activation?
Pick an observable milestone strongly correlated with long-term value, reflecting your core job-to-be-done—e.g., “created first project + invited teammate” (B2B collaboration), “first order placed” (ecom), or “completed first workout + saved a plan” (fitness app). Validate via cohort retention and monetization.
How do we measure Referrals effectively?
Track invite send and acceptance rates, percentage of new users from referrals, and the LTV of referred cohorts. Use double-sided, value-aligned incentives and measure fraud/low-quality signups. Attribute incrementality with holdouts where feasible.
Is AARRR only for PLG and startups?
No. It applies to ecommerce, mobile apps, and B2B with sales assist. For enterprise sales, adapt Activation to opportunity creation/POC completion and Retention to active deployments/renewals; integrate CRM stages with product telemetry.
How long to implement an AARRR program?
A v1 dashboard and definitions usually take 2–4 weeks if basic analytics and billing/CRM data exist. Expect meaningful lifts within a quarter as you focus experiments on the primary bottleneck and link improvements to LTV/CAC and payback.
How does AARRR handle privacy and attribution changes?
Anchor on first-party, consented data and server-side events. Use cohort-based payback and controlled tests (geo/time-sliced) to value upper-funnel and Referral programs. Rely less on fragile last-click attribution.
