

1. What Is the Gaps Model of Service Quality?
The Gaps Model of Service Quality is a management framework that explains why customers experience disappointing service and how organizations can fix it. It identifies a set of “gaps” inside the organization—misunderstandings, missing standards, delivery breakdowns, and misaligned communications—that together create the ultimate gap customers notice: the difference between what they expect and what they perceive they received.
In the customer, service, CRM, and CX arena, the model serves as a diagnostic map. It helps leaders trace customer dissatisfaction back to specific, controllable causes: Do we understand what customers expect? Have we translated that into clear standards? Are we delivering to those standards? Are we promising things we cannot reliably deliver? By addressing the internal gaps methodically, you close the external gap and raise perceived quality.
Consultants and executives use the Gaps Model widely because it is both intuitive and operational. It turns the fuzzy idea of “service quality” into a set of concrete questions and accountabilities that cut across marketing, operations, and frontline teams.
2. Origin and Background
The Gaps Model was developed by A. Parasuraman, Valarie A. Zeithaml, and Leonard L. Berry. The conceptual model was introduced in a 1985 Journal of Marketing article (“A Conceptual Model of Service Quality and Its Implications for Future Research”). The authors later created a survey instrument, SERVQUAL, published in 1988, to measure the customer-facing gap.
Why it was created: Services are intangible, variable, and delivered through people and systems. In the 1980s, organizations lacked a rigorous way to explain inconsistent service outcomes and prioritize fixes. The Gaps Model provided a structure to connect customer perceptions to internal processes and management practices.
How it became known: The model spread through services marketing scholarship, business school curricula, and consulting engagements. It became a staple of CX programs because it links abstract concepts (expectations, perceptions) to practical levers (standards, training, process, communications).
3. How the Gaps Model Works
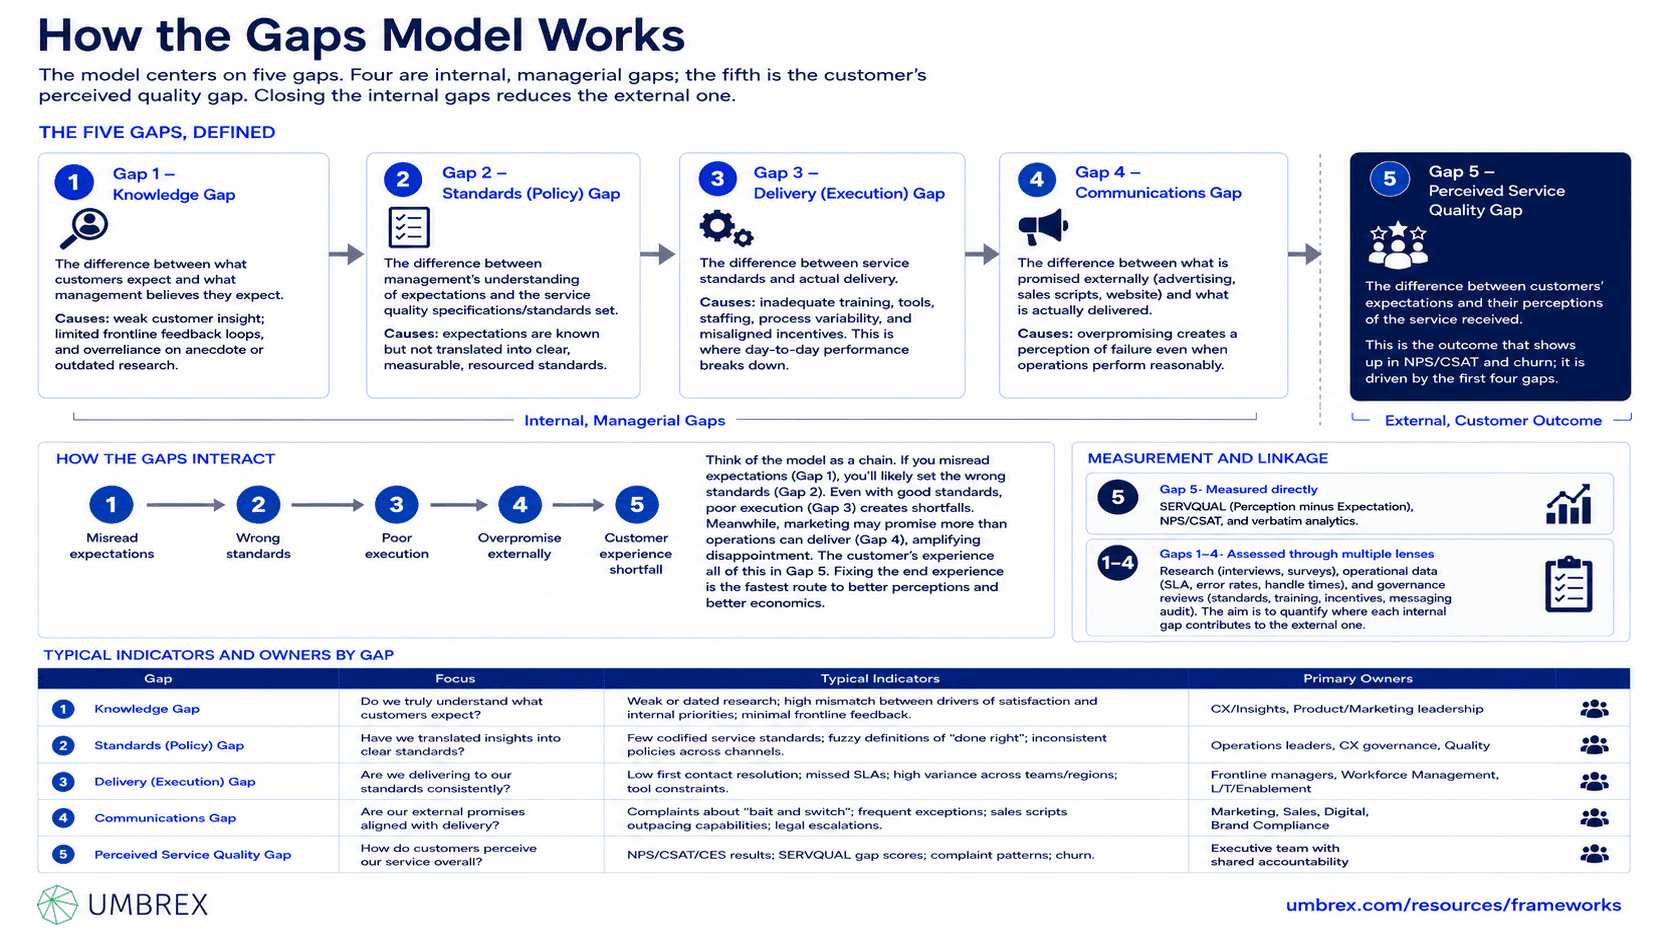
The model centers on five gaps. Four are internal, managerial gaps; the fifth is the customer’s perceived quality gap. Closing the internal gaps reduces the external one.
The five gaps, defined
- Gap 1 – Knowledge Gap: The difference between what customers expect and what management believes they expect. Causes include weak customer insight, limited frontline feedback loops, and overreliance on anecdote or outdated research.
- Gap 2 – Standards (Policy) Gap: The difference between management’s understanding of expectations and the service quality specifications/standards set. Even when expectations are known, organizations may fail to translate them into clear, measurable, resourced standards.
- Gap 3 – Delivery (Execution) Gap: The difference between service standards and actual delivery. Causes include inadequate training, tools, staffing, process variability, and misaligned incentives. This is where day-to-day performance breaks down.
- Gap 4 – Communications Gap: The difference between what is promised externally (advertising, sales scripts, website) and what is actually delivered. Overpromising creates a perception of failure even when operations perform reasonably.
- Gap 5 – Perceived Service Quality Gap: The difference between customers’ expectations and their perceptions of the service received. This is the outcome that shows up in NPS/CSAT and churn; it is driven by the first four gaps.
How the gaps interact
Think of the model as a chain. If you misread expectations (Gap 1), you’ll likely set the wrong standards (Gap 2). Even with good standards, poor execution (Gap 3) creates shortfalls. Meanwhile, marketing may promise more than operations can deliver (Gap 4), amplifying disappointment. The customer experiences all of this as Gap 5. Fixing the chain upstream is the fastest route to better perceptions and better economics.
Typical indicators and owners by gap
- Gap 1 (Knowledge): Indicators—weak or dated research, high mismatch between drivers of satisfaction and internal priorities, minimal frontline feedback. Owners—CX/Insights, Product/Marketing leadership.
- Gap 2 (Standards): Indicators—few codified service standards, fuzzy definitions of “done right,” inconsistent policies across channels. Owners—Operations leaders, CX governance, Quality.
- Gap 3 (Delivery): Indicators—low first contact resolution, missed SLAs, high variance across teams/regions, tool constraints. Owners—Frontline managers, Workforce Management, IT/Enablement.
- Gap 4 (Communications): Indicators—complaints about “bait and switch,” frequent exceptions, sales scripts outpacing capabilities, legal escalations. Owners—Marketing, Sales, Digital, Brand Compliance.
- Gap 5 (Perceived Quality): Indicators—NPS/CSAT/CES results, SERVQUAL gap scores, complaint patterns, churn. Owners—Executive team with shared accountability.
Measurement and linkage
- Gap 5: Often measured directly via SERVQUAL (Perception minus Expectation), NPS/CSAT, and verbatim analysis.
- Gaps 1–4: Assessed through a combination of research (interviews, surveys), operational data (SLAs, error rates, handle times), and governance reviews (standards, training, incentives, messaging audits). The aim is to quantify where each internal gap contributes to the external one.
4. When to Use the Gaps Model
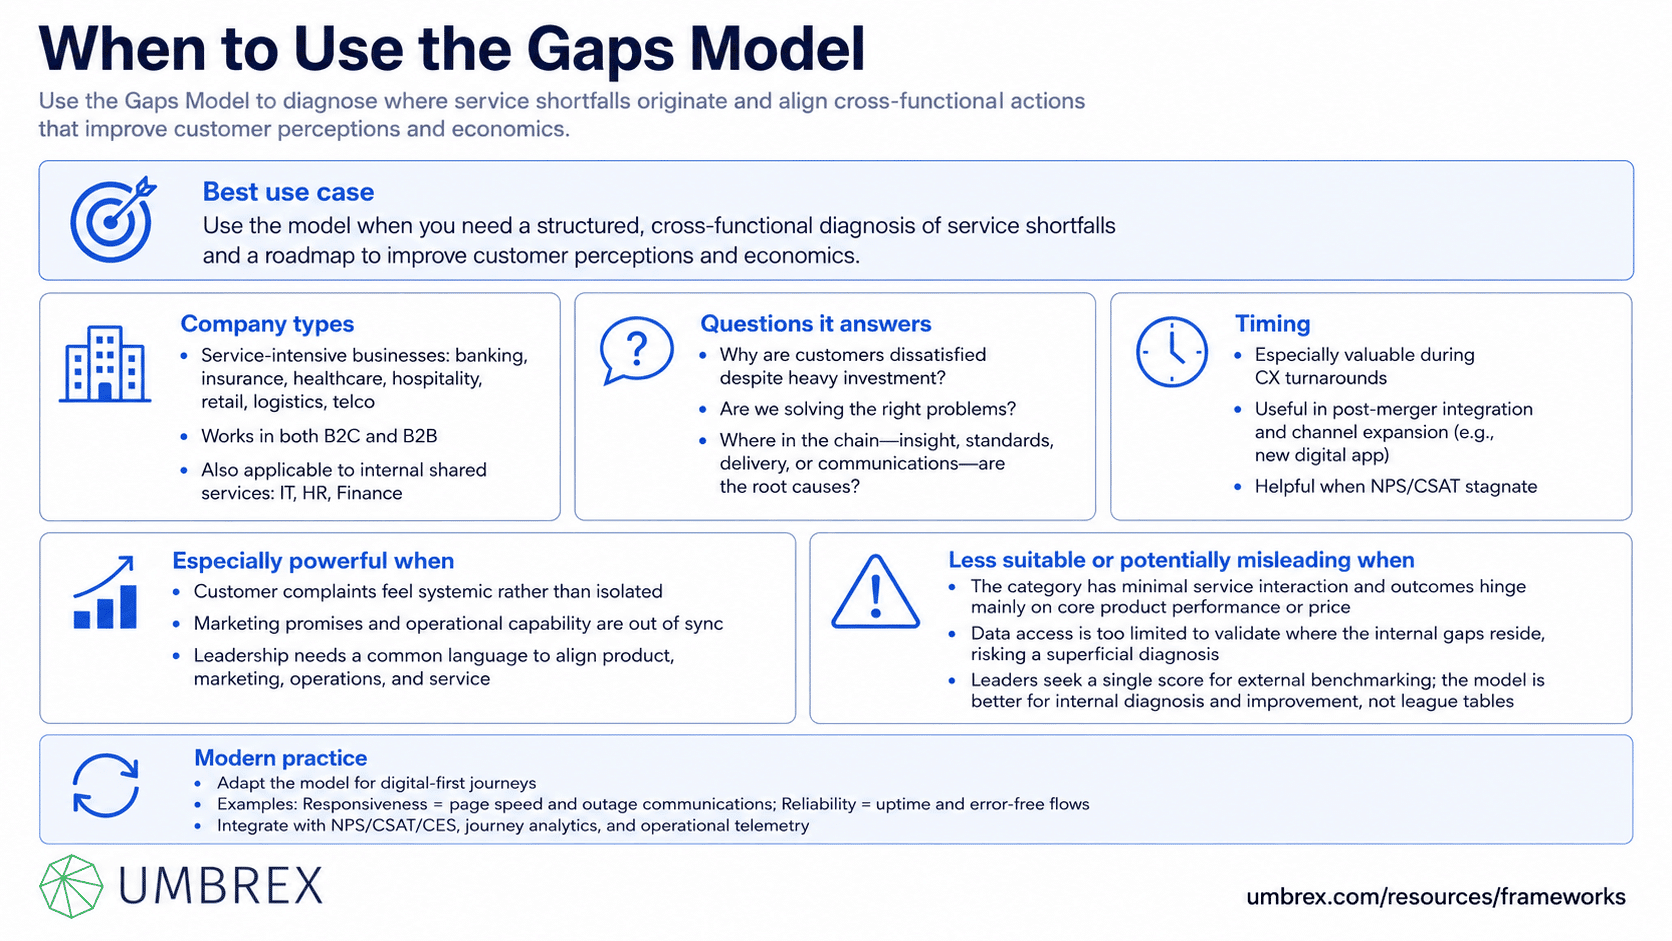
Use the model when you need a structured, cross-functional diagnosis of service shortfalls and a roadmap to improve customer perceptions and economics.
- Company types: Service-intensive businesses (banking, insurance, healthcare, hospitality, retail, logistics, telco), B2C and B2B, as well as internal shared services (IT, HR, Finance).
- Questions it answers: Why are customers dissatisfied despite heavy investment? Are we solving the right problems? Where in our chain—insight, standards, delivery, or communications—are the root causes?
- Timing: Particularly valuable during CX turnarounds, post-merger integration, channel expansion (e.g., new digital app), or when NPS/CSAT stagnate.
Especially powerful when:
- Customer complaints feel systemic rather than isolated.
- Marketing promises and operational capability are out of sync.
- Leadership needs a common language to align product, marketing, operations, and service.
Less suitable or potentially misleading when:
- Your category has minimal service interaction and outcomes hinge primarily on core product performance or price.
- Data access is too limited to validate where the internal gaps reside—risking a superficial diagnosis.
- Leaders seek a single score for external benchmarking; the model is best for internal diagnosis and improvement, not league tables.
Modern practice adapts the model for digital-first journeys (e.g., Responsiveness as page speed and outage comms; Reliability as uptime and error-free flows) and integrates it with outcome metrics (NPS/CSAT/CES), journey analytics, and operational telemetry.
5. How to Apply the Gaps Model: Step-by-Step
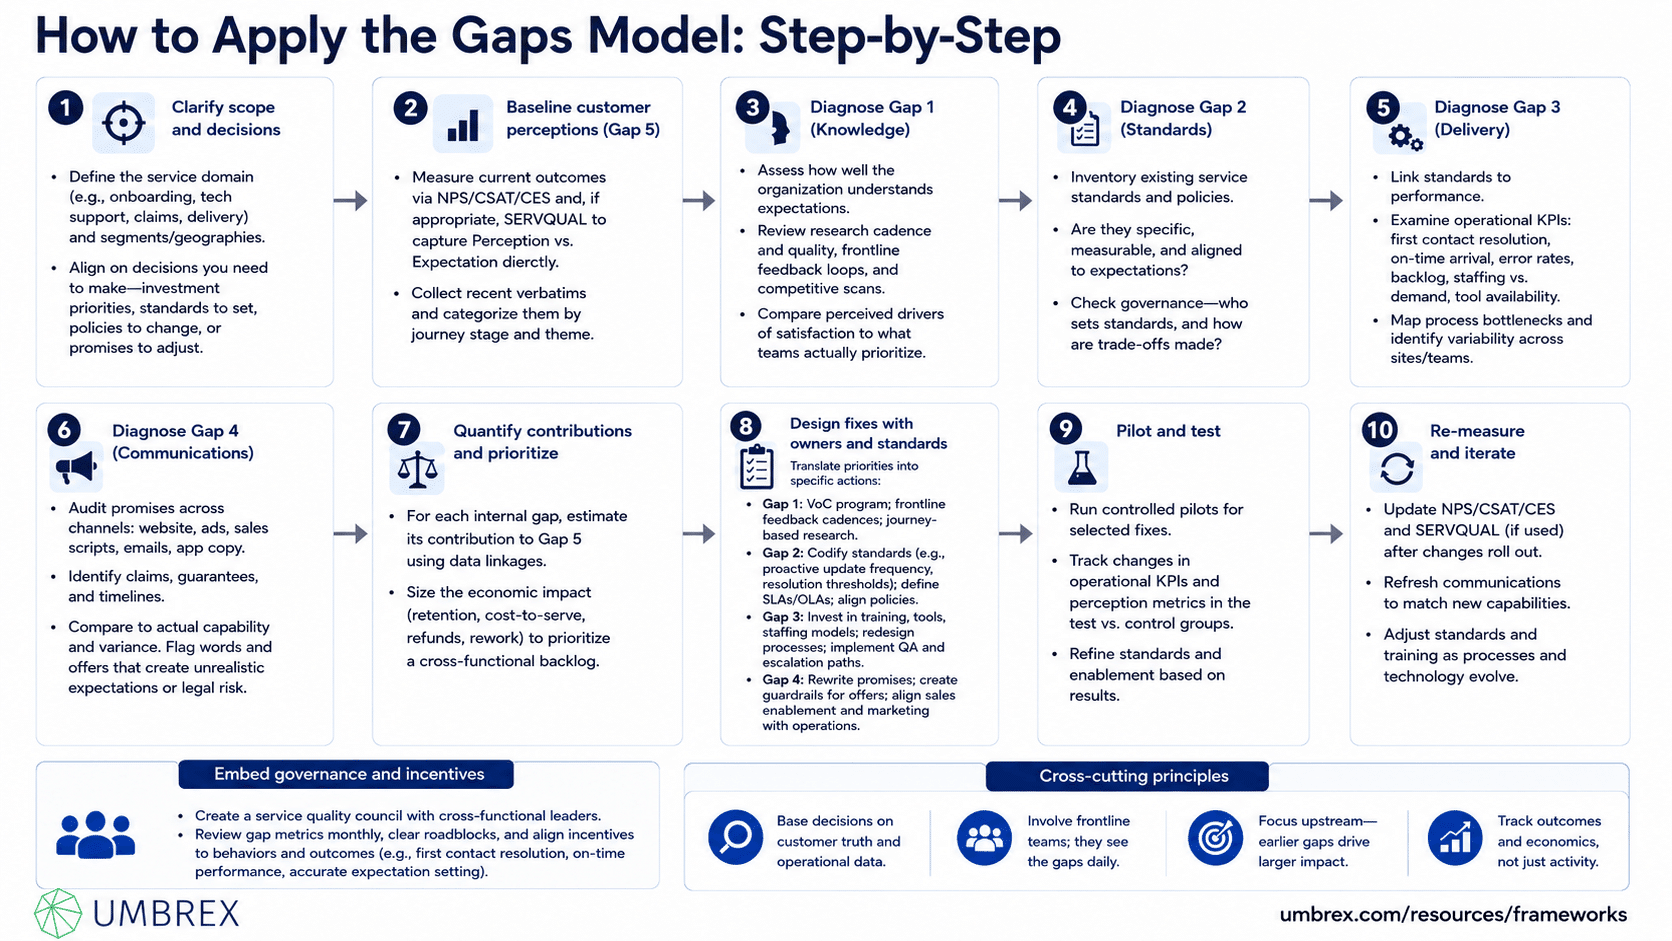
- Clarify scope and decisions
Define the service domain (e.g., onboarding, tech support, claims, delivery) and segments/geographies. Align on decisions you need to make—investment priorities, standards to set, policies to change, or promises to adjust.
- Baseline customer perceptions (Gap 5)
Measure current outcomes via NPS/CSAT/CES and, if appropriate, SERVQUAL to capture Perception vs. Expectation directly. Collect recent verbatims and categorize them by journey stage and theme.
- Diagnose Gap 1 (Knowledge)
Assess how well the organization understands expectations. Review research cadence and quality, frontline feedback loops, and competitive scans. Conduct targeted interviews with customers and frontline staff. Compare perceived drivers of satisfaction to what teams actually prioritize.
- Diagnose Gap 2 (Standards)
Inventory existing service standards and policies. Are they specific, measurable, and aligned to expectations? Where are there gaps (e.g., no standard for proactive updates during delays)? Check governance—who sets standards, and how are trade-offs made?
- Diagnose Gap 3 (Delivery)
Link standards to performance. Examine operational KPIs: first contact resolution, on-time arrival, error rates, backlog, staffing vs. demand curves, tool availability. Sample calls/chats, shadow field teams, and map process bottlenecks. Identify variability across sites/teams.
- Diagnose Gap 4 (Communications)
Audit promises across channels: website, ads, sales scripts, emails, app copy. Identify claims, guarantees, and timelines. Compare to actual capability and variance. Flag words and offers that create unrealistic expectations or legal risk.
- Quantify contributions and prioritize
For each internal gap, estimate its contribution to Gap 5 using data linkages (e.g., outages without proactive comms drive low Responsiveness perceptions; missed appointments drive Reliability complaints). Size the economic impact (retention, cost-to-serve, refunds, rework) to prioritize a cross-functional backlog.
- Design fixes with owners and standards
Translate priorities into specific actions:
– Gap 1: establish a VoC program; frontline feedback cadences; journey-based research.
– Gap 2: codify standards (e.g., proactive update frequency, resolution time thresholds); define SLAs/OLAs; align policies across channels.
– Gap 3: invest in training, tools, staffing models; redesign processes; implement QA and escalation paths.
– Gap 4: rewrite promises; create guardrails for offers; align sales enablement and marketing with operations.
- Pilot and test
Run controlled pilots for selected fixes. Track changes in operational KPIs and perception metrics in the test vs. control groups. Refine standards and enablement based on results.
- Embed governance and incentives
Create a service quality council with cross-functional leaders. Review gap metrics monthly, clear roadblocks, and align incentives to behaviors and outcomes (e.g., first contact resolution, on-time performance, accurate expectation setting).
- Re-measure and iterate
Update NPS/CSAT/CES and SERVQUAL (if used) after changes roll out. Refresh communications to match new capabilities. Adjust standards and training as processes and technology evolve.
6. Example: The Gaps Model in Action
Context: “QuickCart,” an $850M online grocery service, saw rising churn and social media complaints about missed delivery windows and substitutions. Marketing continued to promise “freshness guaranteed” and “delivery in 60 minutes,” but operations struggled during peak hours.
Problem: NPS declined 12 points in a year. Leadership debated whether to invest in warehouse automation, expand delivery capacity, or redesign the app experience. They needed a clear diagnosis.
Application: The team applied the Gaps Model across two segments (urban families, young professionals) and two markets. They:
– Measured Gap 5 via CSAT and a short SERVQUAL-like module tailored to delivery (expectations vs. perceptions on timeliness, accuracy, communication).
– Interviewed customers and frontline shoppers/drivers (Gap 1).
– Reviewed standards and policies on substitution rules, delivery windows, and proactive notifications (Gap 2).
– Analyzed operational data: slot fill rates, picker productivity, driver routing, forecast vs. actual demand, and cancelation rates (Gap 3).
– Audited website/app claims, push notifications, and sales promos for delivery time promises (Gap 4).
Insights:
- Gap 1: Teams underestimated how much customers valued proactive communication during delays; internal priorities focused on assortment breadth instead.
- Gap 2: Delivery window standards were vague (“arrive as close as possible”); no policy on when to notify customers of delays; substitution policy lacked customer preferences capture.
- Gap 3: Forecasting underpredicted weekend demand; staffing and routing struggled; picker tools didn’t flag likely out-of-stock items early, causing last-minute substitutions.
- Gap 4: “Delivery in 60 minutes” was displayed to all users, even when local capacity made it unrealistic; app banners promised “exact substitutions” without caveats.
- Gap 5: Biggest perception gaps were Reliability (on-time, accurate order) and Responsiveness (proactive updates).
Actions:
- Gap 1: Instituted weekly frontline feedback huddles and a VoC dashboard showing top complaint themes by market.
- Gap 2: Set explicit standards: 90-minute standard windows with tiered options; proactive notification if ETA slips by 10+ minutes; substitution preferences captured at checkout and enforced in picking app.
- Gap 3: Upgraded demand forecasting; added surge staffing playbooks; enhanced picker app to flag OOS risk and recommend preference-aligned substitutes; created a “delay playbook” for driver comms.
- Gap 4: Rewrote promises: “Most deliveries in 90 minutes; see your live ETA;” conditional offers based on local capacity; updated promo copy with clear qualifiers.
Outcomes (three months): On-time delivery improved from 76% to 90%; proactive delay notifications increased from 18% to 82% of delayed orders. CSAT on delivery rose by 9 points; complaint volume fell 31%. Churn declined by 120 bps in pilot markets. Marketing shifted budget from broad “60-minute” promos to targeted capacity-based offers, improving margin by 90 bps.
7. Strengths and Limitations
Strengths
- End-to-end diagnosis: Connects customer perceptions to specific organizational causes across insight, standards, delivery, and communications.
- Cross-functional alignment: Creates a common language for marketing, operations, and frontline teams to prioritize the right fixes.
- Actionable: Points to practical levers—better research, clearer standards, improved staffing/tools, honest promises—rather than vague “be more customer-centric.”
- Scalable: Works for a single journey or enterprise-wide programs; adaptable to both digital and physical channels.
Limitations
- Descriptive, not prescriptive economics: The model highlights where gaps exist but does not by itself quantify ROI; you must overlay financial impact.
- Measurement complexity: Internal gaps are not always directly measurable; requires triangulating surveys, operations data, and qualitative insight.
- Risk of oversimplification: Five gaps can mask nuanced interdependencies (e.g., technology constraints vs. policy choices) without deeper analysis.
- Benchmarking pitfalls: Not designed for cross-company rankings; sampling and context differences can mislead.
8. Common Pitfalls (and How to Avoid Them)
- Focusing only on Gap 5 (scores) without tracing causes
What goes wrong: Teams chase NPS/CSAT without fixing upstream issues.
How to avoid: Always link perception metrics to Gaps 1–4; require root-cause analysis and owner-assigned actions.
- Assuming expectations are obvious
What goes wrong: Internal views substitute for customer evidence.
How to avoid: Refresh research, leverage frontline insights, and validate expectations by segment and journey stage.
- Vague or unenforced standards
What goes wrong: “Do your best” policies yield inconsistent performance.
How to avoid: Codify standards with measurable thresholds and accountability; align incentives and QA.
- Overpromising in marketing and sales
What goes wrong: Aspirational claims create avoidable disappointment and legal risk.
How to avoid: Create guardrails tying promises to operational capability; review claims with operations before launch.
- Underinvesting in enablement
What goes wrong: Standards exist on paper but frontline lacks tools/training.
How to avoid: Pair standards with enablement (training, systems, staffing) and monitor adherence.
- One-and-done diagnostics
What goes wrong: Early wins fade; gaps re-open as offerings evolve.
How to avoid: Institutionalize a cadence: measure, fix, re-measure; keep a living backlog tied to Gap owners.
9. How the Gaps Model Relates to Other Frameworks
- SERVQUAL: SERVQUAL is the measurement instrument often paired with the Gaps Model to quantify Gap 5 (Perception – Expectation) across five dimensions (RATER). Use SERVQUAL to size the customer-facing gap; use the Gaps Model to identify and fix internal causes.
- RATER (Reliability, Assurance, Tangibles, Empathy, Responsiveness): RATER provides the dimensions customers use to judge service. Map Gap 2 (standards) and Gap 3 (delivery) to RATER-aligned standards and KPIs.
- NPS/CSAT/CES: These are outcome metrics indicating Gap 5 health. Use them alongside the Gaps Model to track improvement and ensure upstream fixes translate to better perceptions and lower effort.
- Customer Journey Mapping and Service Blueprinting: Once gaps are identified, journey maps show where they occur; blueprints reveal backstage processes to redesign.
- Lean Six Sigma, COPC, ITIL: Process and operational frameworks provide methods to close Gap 3 (delivery) and sustain standards.
- Kano Model: Kano helps prioritize which features or service attributes to elevate. Ensure Gap 2/3 basics are solid before investing in delighters that may backfire if core reliability is weak.
- CLV and churn modeling: Quantify the economic payoff of closing specific gaps to prioritize investments and gain sponsor support.
In practice, a typical sequence is: measure outcomes (NPS/CSAT/CES) → diagnose with the Gaps Model → design fixes via journey maps/blueprints → implement with Lean/Six Sigma → validate impact through CLV/churn analytics.
10. Key Takeaways
- The Gaps Model explains customer dissatisfaction by tracing it to four internal gaps—knowledge, standards, delivery, and communications—that drive the customer-facing gap.
- It is a cross-functional diagnostic that converts vague quality issues into specific, fixable causes with clear owners.
- Use SERVQUAL or NPS/CSAT/CES to measure Gap 5; use operational data, audits, and interviews to locate and size Gaps 1–4.
- Fix basics first: align promises with capability, codify standards, enable frontline delivery, and establish a reliable feedback loop.
- Overlay economics (retention, cost-to-serve, refunds, rework) to prioritize and sustain investment.
- Make it a system—measure, fix, re-measure—rather than a one-off diagnostic or score-chasing exercise.
11. FAQs About the Gaps Model of Service Quality
Is the Gaps Model the same as SERVQUAL?
No. The Gaps Model is the conceptual framework that identifies internal and external gaps causing service quality issues. SERVQUAL is a survey instrument that measures the customer-facing gap (Gap 5) across RATER dimensions. They are complementary: diagnose with the model, measure with SERVQUAL.
How do we measure “expectations” reliably?
Use clear wording (e.g., expectations of an “excellent provider” or “what you expected from us”), keep scales consistent, and target recent users for recall accuracy. Where expectations are difficult to capture, use performance-only measures (SERVPERF-style) and derive importance weights or link to outcomes statistically.
Does the model work for digital self-service?
Yes. Translate gaps to digital constructs: Gap 3 (delivery) becomes uptime, latency, defect rates, and successful task completion; Gap 4 (communications) covers release notes, in-app messaging, and SLA claims; Gap 2 (standards) includes UX heuristics and response-time SLAs.
How long does a Gaps Model project take?
A focused diagnostic can be completed in 6–10 weeks: 2–3 weeks for scoping and baseline measurement, 2–3 for internal gap assessments, and 2–4 for prioritization and pilots. Implementation timelines depend on the complexity of process, policy, and technology changes.
Can small or early-stage companies use it?
Absolutely. Start lean: gather frontline insights weekly (Gap 1), set a handful of non-negotiable standards (Gap 2), track a few execution KPIs (Gap 3), and align promises to capability (Gap 4). Revisit monthly and scale as systems mature.
