

1. What Is the Kano Model of Customer Satisfaction?
The Kano Model is a customer experience and product/service design framework that classifies features into categories based on how their presence (or absence) affects customer satisfaction. Rather than treating all requirements as equal, it distinguishes between “hygiene” basics that prevent dissatisfaction, “performance” attributes that drive proportional satisfaction, and “delighters” that create disproportionate enthusiasm. The classic categories are: Must-be (Basic), One-dimensional (Performance), Attractive (Delighters), Indifferent, and Reverse.
In the customer, service, CRM, and CX domains, Kano’s value is to clarify which improvements will actually move the needle on loyalty and perceived quality. It is often used by consultants and product/service leaders to prioritize roadmaps, design service experiences, and decide where to overinvest versus where to simply meet the bar. The model is particularly helpful in avoiding the common trap of over-engineering basics while underinvesting in differentiating experiences.
Practically, the Kano Model combines a structured survey method with managerial judgment. It turns qualitative customer preferences into a small set of categories that guide what to build, fix, or elevate—grounded in how customers will react when a specific feature exists or doesn’t.
2. Origin and Background
The Kano Model was introduced by Professor Noriaki Kano in 1984 in his paper “Attractive Quality and Must-be Quality,” published by the Japanese Society for Quality Control. It emerged from the quality movement and early customer satisfaction research in Japan, aiming to explain why some improvements delight customers while others merely remove dissatisfaction.
Kano’s insight spread globally through quality management circles (TQM, Six Sigma), product management, service design, and business schools. Over time, practitioners standardized a survey technique—paired functional/dysfunctional questions with a five-point response scale—and added practical tools such as satisfaction/dissatisfaction coefficients to quantify impact.
The core problem it addresses: Not all features are created equal. Treating every requirement as a linear driver of satisfaction leads to misallocated resources and undifferentiated offerings. The Kano Model provides a rigorous way to separate “musts” from “more-is-better” and “wow” factors, so leaders can prioritize with confidence.
3. How the Kano Model Works
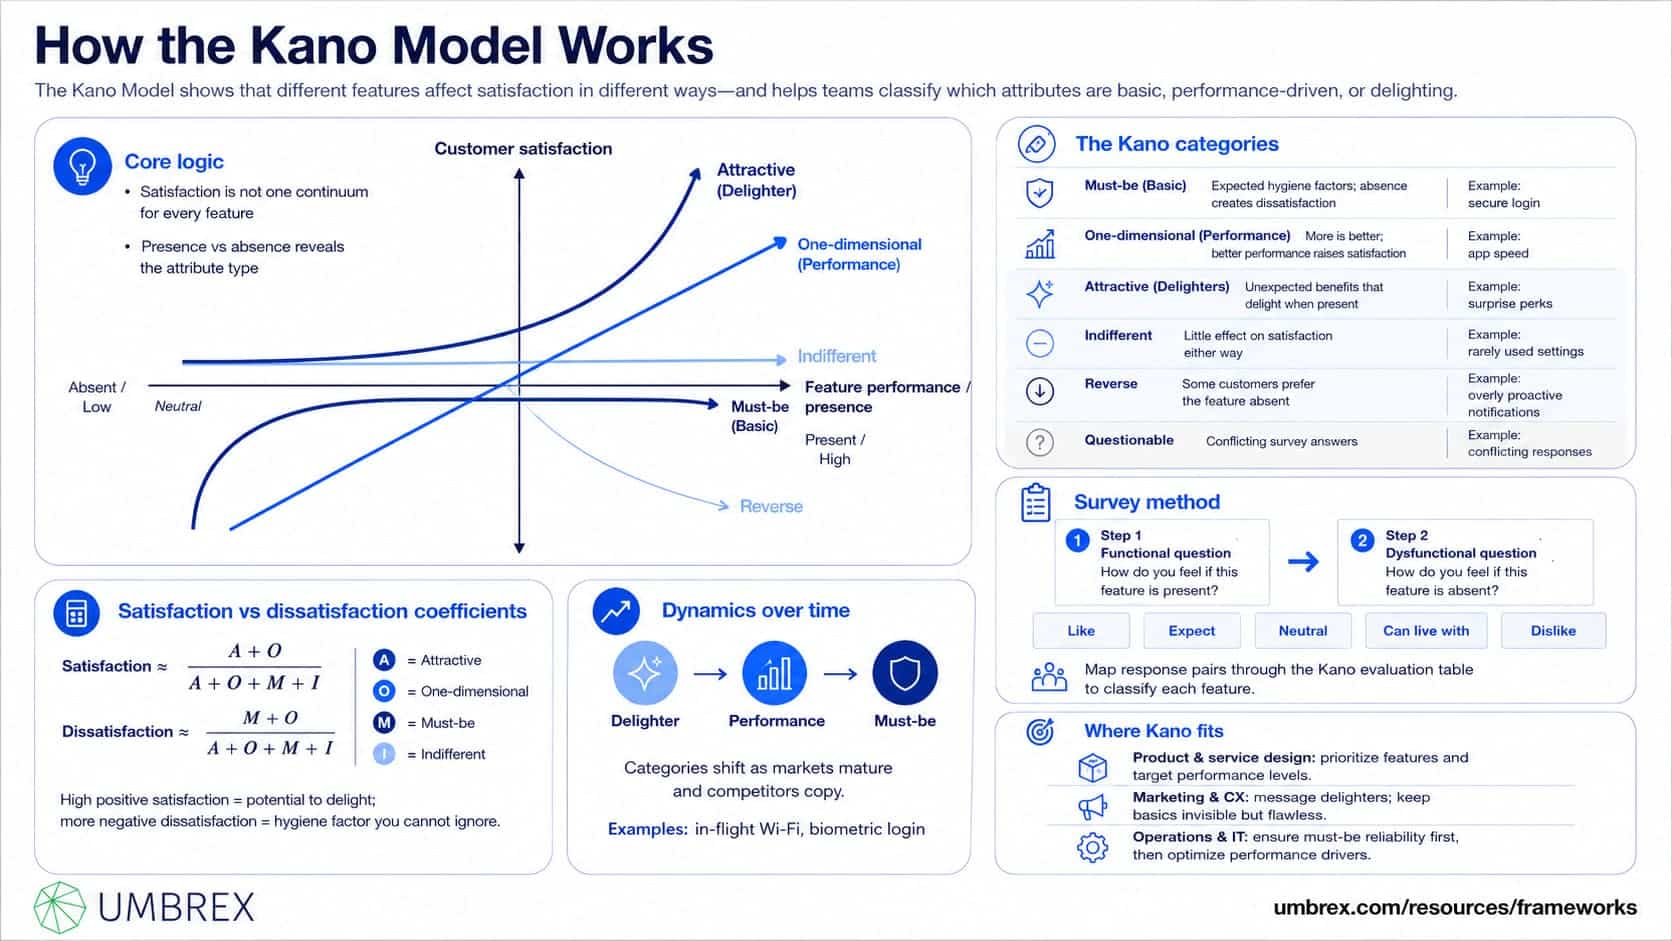
The model rests on two ideas. First, customer satisfaction is not a single continuum from “bad” to “good” for every feature; different attributes have different shapes of impact. Second, you can reveal that shape by asking how customers feel when a feature is present and when it is absent, then classifying the pattern.
The Kano categories
- Must-be (Basic): Hygiene factors customers take for granted. Their absence causes strong dissatisfaction; their presence does not increase satisfaction much. Example: on-time flight arrival for an airline, or secure login for a banking app.
- One-dimensional (Performance): “More is better.” Satisfaction rises roughly proportionally with performance; absence or low performance reduces satisfaction. Example: mobile app speed, seat pitch on an airplane, call center resolution speed.
- Attractive (Delighters): Unexpected features that create enthusiasm when present but do not cause dissatisfaction if absent. Example: proactive fee refunds, seamless auto-upgrades, surprise perks.
- Indifferent: Attributes that don’t meaningfully affect satisfaction either way for the target customer. Example: a rarely used settings option; a cosmetic variation customers don’t value.
- Reverse: Features that some customers dislike when present and prefer absent. Example: overly proactive notifications; “helpful” automation that removes control.
The survey method (functional/dysfunctional questions)
For each candidate feature or service attribute, customers answer two questions:
- Functional: “How do you feel if this feature is present?”
- Dysfunctional: “How do you feel if this feature is absent?”
Each uses a five-option response scale:
“I like it that way,” “I expect it that way,” “I am neutral,” “I can live with it that way,” and “I dislike it that way.”
Responses are mapped via the standard Kano evaluation table into a category (Must-be, One-dimensional, Attractive, Indifferent, Reverse, or Questionable if answers conflict). The dominant category across respondents becomes the feature’s classification, often complemented by coefficients that indicate how strongly it impacts satisfaction.
Satisfaction and dissatisfaction coefficients
Practitioners often compute two simple coefficients to quantify the directional impact:
a satisfaction coefficient (how much the presence of the feature can increase satisfaction) and a dissatisfaction coefficient (how much its absence can decrease satisfaction). A common approach calculates:
Satisfaction ≈ (Attractive + One-dimensional) / (Attractive + One-dimensional + Must-be + Indifferent)
and
Dissatisfaction ≈ −(Must-be + One-dimensional) / (Attractive + One-dimensional + Must-be + Indifferent).
In plain terms: high positive satisfaction means the feature can delight; high (more negative) dissatisfaction means it’s a hygiene factor you cannot ignore.
Dynamics over time
Categories are not static. Delighters often decay into Performance attributes, and eventually into Must-be basics, as markets mature and competitors copy. Wi‑Fi on flights moved from delighter to expected for many travelers; biometric login followed a similar path in banking apps. Periodic re-assessment is essential.
Where Kano fits in the organization
- Product and service design: Identify which features to prioritize and the level of performance to target.
- Marketing and CX: Decide which benefits to message (delighters) and which to keep invisible but flawless (basics).
- Operations and IT: Ensure resources cover must-be reliability first, then optimize performance drivers, and selectively fund delighters for differentiation.
4. When to Use the Kano Model
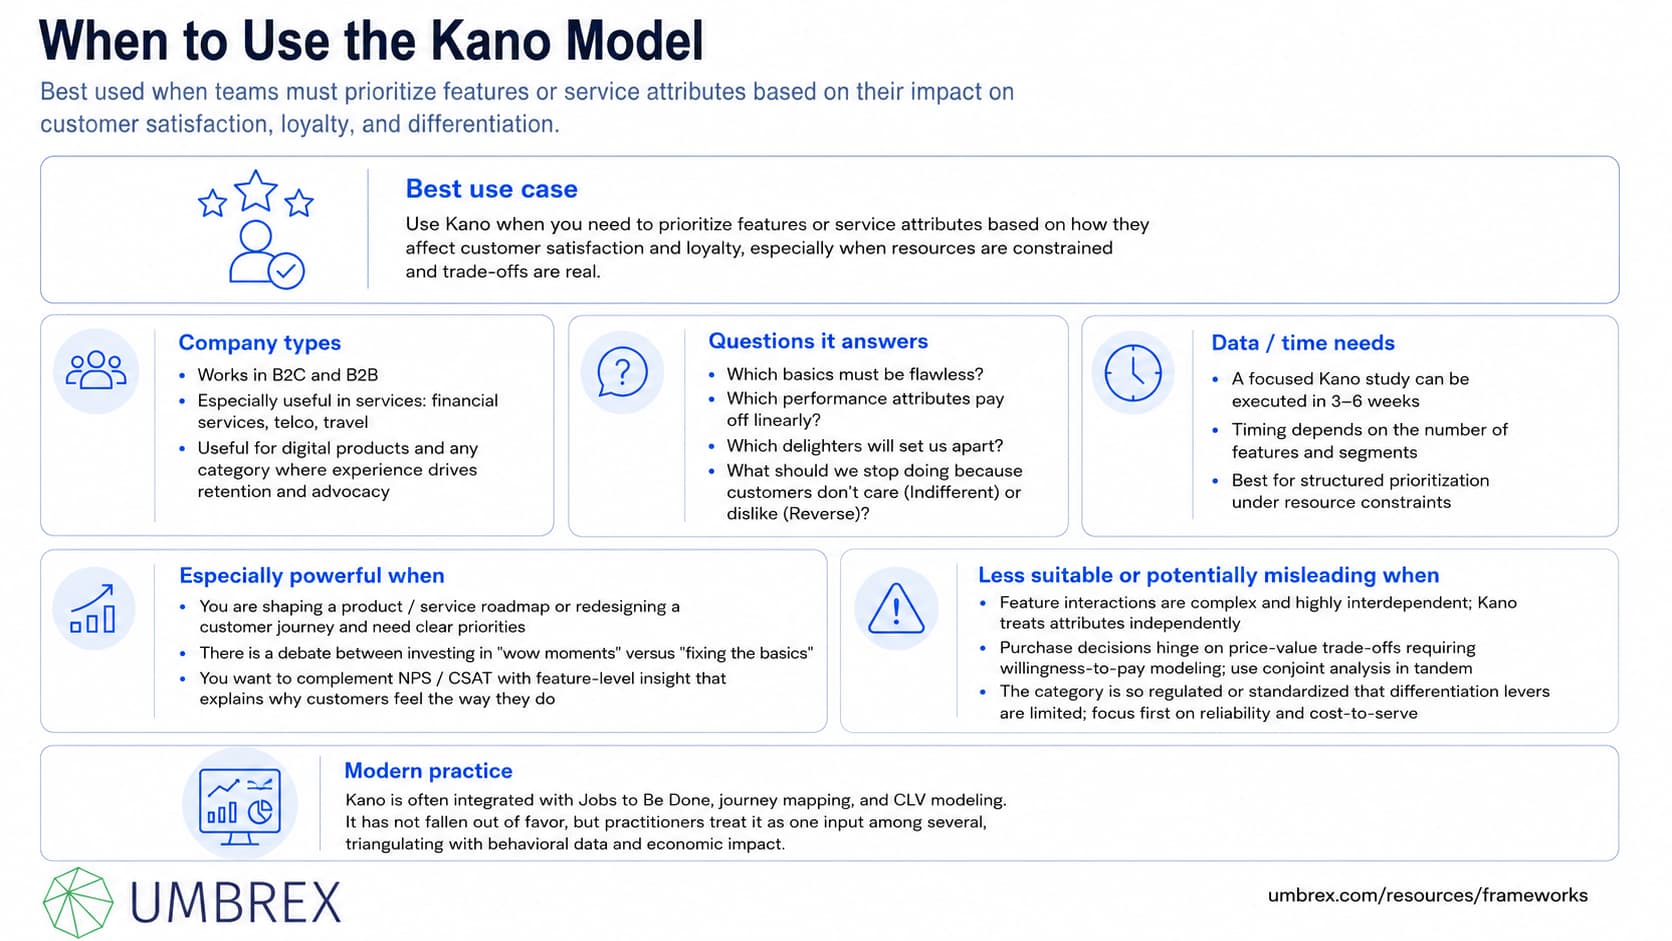
Use Kano when you need to prioritize features or service attributes based on how they affect customer satisfaction and loyalty, especially when resources are constrained and trade-offs are real.
- Company types: Works in B2C and B2B; especially useful in services (financial services, telco, travel), digital products, and any category where experience drives retention and advocacy.
- Questions it answers: Which basics must be flawless? Which performance attributes pay off linearly? Which delighters will set us apart? What should we stop doing because customers don’t care (Indifferent) or dislike (Reverse)?
- Data/time needs: A focused Kano study can be executed in 3–6 weeks, depending on the number of features and segments.
Especially powerful when:
- You are shaping a product/service roadmap or redesigning a customer journey and need clear priorities.
- There is a debate between investing in “wow moments” versus “fixing the basics.”
- You want to complement NPS/CSAT with feature-level insight that explains why customers feel the way they do.
Less suitable or potentially misleading when:
- Feature interactions are complex and highly interdependent (Kano treats attributes independently).
- Purchase decisions hinge on price-value trade-offs requiring willingness-to-pay modeling (use conjoint analysis in tandem).
- Your category is so regulated or standardized that differentiation levers are limited; focus first on reliability and cost-to-serve.
Modern practice: Kano is often integrated with Jobs to Be Done, journey mapping, and CLV modeling. It has not fallen out of favor, but practitioners treat it as one input among several, triangulating with behavioral data and economic impact.
5. How to Apply the Kano Model: Step-by-Step
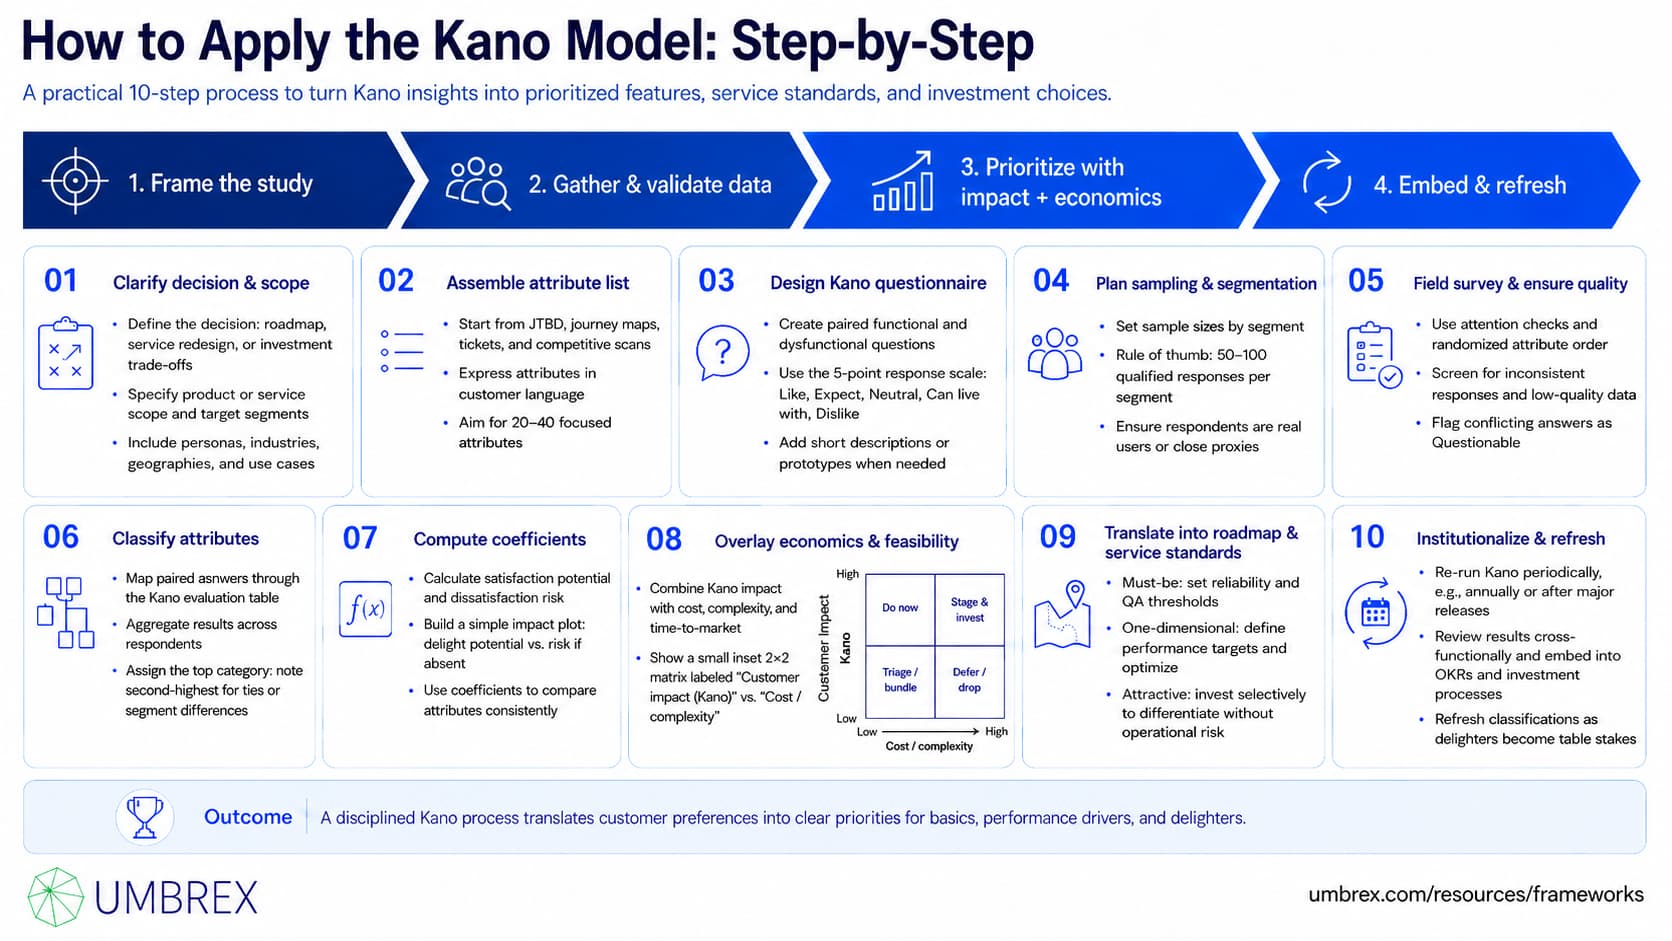
- Clarify the decision and scope
Define the choices the study will inform—e.g., next-quarter roadmap, service redesign for a specific journey, or investment trade-offs. Specify the product/service scope and the target segments (personas, industries, geographies).
- Assemble the candidate attribute list
Start from customer needs (Jobs to Be Done), journey maps, support tickets, and competitive scans. Express each attribute at a level customers can understand (“Same-day delivery in major cities,” “24/7 live chat with under-2-minute wait,” “Automatic fee refunds when we fail SLAs”). Aim for 20–40 attributes for a focused study.
- Design the Kano questionnaire
For each attribute, create the paired questions:
– Functional: “How do you feel if the service provides [attribute]?”
– Dysfunctional: “How do you feel if the service does not provide [attribute]?”
Response options: “I like it that way,” “I expect it that way,” “I am neutral,” “I can live with it that way,” “I dislike it that way.” Include a brief description or prototype where needed to ensure comprehension.
- Plan sampling and segmentation
Define sample sizes per segment (e.g., consumer vs. business travelers; SMB vs. enterprise buyers). As a rule of thumb, 50–100 qualified responses per segment are sufficient for directional insights; more if decisions are high-stakes. Ensure respondents are actual users or close proxies.
- Field the survey and ensure quality
Use attention checks, randomized attribute order, and clear examples. Screen for inconsistent responses (e.g., answering “I like” to both functional and dysfunctional—flagged as Questionable) and drop low-quality data.
- Classify attributes using the evaluation table
Map each respondent’s paired answers to a Kano category using the standard evaluation table, then aggregate across respondents. Assign the feature to the category with the highest frequency, noting the second-highest as a tie-breaker or for segment differences. If “Questionable” dominates, recheck attribute wording.
- Compute satisfaction/dissatisfaction coefficients
For each attribute, calculate the positive satisfaction potential (driven by Attractive and One-dimensional responses) and the negative dissatisfaction risk (driven by Must-be and One-dimensional). Use these to create a simple impact plot: potential to delight (y-axis) vs. risk if absent (x-axis).
- Overlay economics and feasibility
Combine Kano impact with cost, complexity, and time-to-market. A practical 2×2 is “Customer impact (Kano) vs. Cost/Complexity.” Prioritize:
– High impact, low cost: Do now.
– High impact, high cost: Stage and invest; build business case.
– Low impact, low cost: Triage or bundle.
– Low impact, high cost: Defer or drop.
- Translate into roadmap and service standards
– Must-be: Set non-negotiable reliability and QA thresholds; fix defects before adding bells and whistles.
– One-dimensional: Set performance targets (e.g., “80% of chats answered within 60 seconds”; “App p95 latency under 300 ms”) and optimize.
– Attractive: Invest selectively to differentiate; design for surprise and shareability; ensure operational readiness so delighters don’t backfire.
- Institutionalize and refresh
Re-run Kano periodically (e.g., annually or after major releases) to capture shifts as delighters become table stakes. Socialize results via cross-functional reviews and embed into OKRs and investment processes.
6. Example: Kano in Action
Context: “SkyBridge,” a $2.2B regional airline, faced stagnant NPS and margin pressure. Operations argued for more investment in punctuality; marketing pushed for “wow” moments like free premium Wi‑Fi and surprise upgrades. The CEO needed a fact-based roadmap.
Approach: A Kano study targeted three segments—business travelers, leisure travelers, and frequent flyers (elite). The team tested 28 attributes across booking, airport, in-flight, and post-flight service. Examples: on-time arrival, proactive rebooking during disruptions, fast security lane, gate information accuracy, seat pitch, in-flight Wi‑Fi speed, free snacks, personalized offers, baggage fee transparency, instant compensation for delays, and carbon-offset options.
Findings:
– Must-be: Safety (unsurprisingly), on-time arrival, accurate gate changes, baggage handling reliability, and clear fee disclosure. Dissatisfaction coefficients were high in magnitude (i.e., big downside if absent).
– One-dimensional: Wi‑Fi speed, seat pitch, boarding speed, app reliability, and on-phone support wait time. Satisfaction rose linearly with performance.
– Attractive: Proactive disruption management (automatic rebooking before landing), instant digital vouchers for delays, and surprise seat upgrades on lightly loaded flights—especially for business and elite segments.
– Indifferent: Certain snack options and seatback screens (for frequent flyers who preferred streaming to their own devices).
– Reverse: Autoplaying gate announcements in the app (seen as intrusive) and frequent low-value push promos.
The satisfaction coefficient was highest for proactive disruption management and instant compensation, while the strongest dissatisfaction was tied to on-time arrival and baggage reliability.
Decisions and actions:
– Fix basics first: Invested in turn-time process improvements and baggage tracking to reduce mishandling; set a public on-time performance commitment.
– Optimize performance drivers: Upgraded Wi‑Fi contracts and increased seat pitch on key business routes where willingness-to-pay justified it; added app reliability SLAs.
– Fund select delighters: Built an AI-driven rebooking capability and automated digital vouchers during irregular operations; designed communications to highlight these moments.
Outcomes (two quarters): Mishandled bags decreased by 28%, on-time performance improved by 5 points, and NPS rose by 11 points overall (19 points among business travelers). Complaints during disruptions fell 35%. Marketing reallocated spend from low-ROI perks to reliability and disruption delighters, improving contribution margin by 120 bps.
7. Strengths and Limitations
Strengths
- Sharp prioritization: Distinguishes hygiene basics, linear performance drivers, and true delighters—preventing misallocation of resources.
- Customer-grounded: Uses direct customer reactions to feature presence/absence, not internal opinions.
- Simple, communicable logic: Creates a common language across product, CX, operations, and marketing.
- Dynamic lens: Encourages periodic reassessment as markets evolve and delighters become basics.
- Actionable metrics: Satisfaction/dissatisfaction coefficients translate categories into practical impact scores.
Limitations
- Ignores interdependencies: Evaluates attributes in isolation; interactions can matter (e.g., Wi‑Fi utility depends on power outlets).
- Not an economics model: Does not account for cost, feasibility, or willingness to pay; requires a second step to integrate economics.
- Survey sensitivity: Wording and comprehension affect results; poor design produces “Questionable” classifications.
- Segment variability: Different segments may categorize the same feature differently; a single aggregate category can hide critical differences.
- Temporal drift: Categories shift over time; a one-off study can quickly become stale.
8. Common Pitfalls (and How to Avoid Them)
- Using Kano as a feature wish list without economics
What goes wrong: Teams chase delighters that are expensive and rarely used while basics falter.
How to avoid: Always overlay Kano results with cost, complexity, and CLV impact; prioritize on combined impact.
- Weak survey design and attribute wording
What goes wrong: Ambiguous features lead to “Questionable” responses and noisy classifications.
How to avoid: Pilot the survey; use concrete examples or prototypes; keep attributes specific and customer-facing.
- Ignoring segment differences
What goes wrong: Averages hide that one segment sees a delighter while another is indifferent.
How to avoid: Analyze by persona/segment; consider segment-specific roadmaps or feature gating.
- Overfitting to stated preferences
What goes wrong: Customers overstate interest in delighters they won’t use.
How to avoid: Validate with behavioral data (usage, adoption) and small pilots before scaling.
- Failing to maintain basics
What goes wrong: Investing in “wow” moments while reliability slips, causing churn.
How to avoid: Set must-be SLAs and monitor relentlessly; fix defects before funding delighters.
- Treating categories as permanent
What goes wrong: Yesterday’s delighter becomes today’s expectation; priorities lag the market.
How to avoid: Re-run Kano annually or after major releases; watch competitors for fast shifts.
- Mixing user and buyer responses in B2B
What goes wrong: Conflicting signals (buyers want security/compliance basics; users want usability delighters).
How to avoid: Segment respondents by role; design dual-track priorities.
9. How the Kano Model Relates to Other Frameworks
- Net Promoter System (NPS) and CSAT/CES: NPS/CSAT tell you whether customers are satisfied; Kano explains which features drive satisfaction and why. Use NPS to track outcomes, then Kano to prioritize drivers. CES (effort) often flags Must-be issues.
- Jobs to Be Done (JTBD): JTBD defines the underlying customer outcomes. Kano classifies potential solutions to those jobs by satisfaction impact. Combine them: first understand jobs, then use Kano to choose which features to build.
- Conjoint analysis and price testing: Conjoint quantifies trade-offs and willingness to pay; Kano categorizes satisfaction impact without price. Use Kano to shortlist features and conjoint to set price/packaging.
- MoSCoW and RICE: MoSCoW (Must/Should/Could/Won’t) and RICE (Reach/Impact/Confidence/Effort) are internal prioritization lenses. Kano provides the external voice. Map Kano categories into these frameworks to improve rigor.
- Customer Journey Mapping and Service Blueprinting: Journey maps surface friction and moments that matter; blueprints reveal backstage processes. Kano helps decide which moments to elevate (delighters) and which to stabilize (must-be).
- CLV and churn modeling: Use CLV to size the economic impact of fixing must-be issues or adding delighters; link Kano-driven choices to retention and expansion value.
In practice, high-performing teams run a sequence: JTBD to define needs → Journey mapping to locate moments → Kano to classify features → Conjoint/A/B tests to price and validate → CLV to prioritize investment.
10. Key Takeaways
- The Kano Model classifies features into Must-be, One-dimensional, Attractive, Indifferent, and Reverse based on how presence/absence affects satisfaction.
- Use paired functional/dysfunctional questions to categorize attributes and compute satisfaction/dissatisfaction coefficients for impact.
- Prioritize hygiene (fix Must-be) before optimizing Performance drivers and selectively funding Delighters for differentiation.
- Overlay Kano impact with cost, feasibility, and CLV to turn insights into a robust roadmap and service standards.
- Categories shift over time—reassess periodically and segment results to avoid “average customer” traps.
- Kano complements NPS/CSAT, JTBD, journey mapping, and economics; together they form a complete CX prioritization toolkit.
11. FAQs About the Kano Model of Customer Satisfaction
Is the Kano Model still relevant for digital products and services?
Yes. In fast-moving digital categories, Kano is particularly useful because delighters decay quickly into expectations. Teams use it alongside product analytics and experimentation to keep roadmaps focused on what truly drives satisfaction and loyalty.
How many respondents do I need for a Kano study?
For directional decisions, 50–100 qualified responses per target segment are typically sufficient. For high-stakes investments or fine-grained segmentation, aim higher. More important than raw size is respondent quality and clarity of attribute definitions.
How is Kano different from CSAT or NPS?
CSAT and NPS measure overall satisfaction/advocacy at a point in time. Kano explains which specific features will prevent dissatisfaction, drive proportional satisfaction, or delight. Use NPS/CSAT to track outcomes and Kano to prioritize inputs.
Can small or early-stage companies use Kano?
Absolutely. Start lean with a focused set of attributes (15–25), recruit a small but well-targeted sample, and use results to shape an MVP and near-term roadmap. Validate delighters with quick prototypes or A/B tests before scaling.
How often should we revisit Kano classifications?
At least annually in dynamic markets, or after major releases/competitive shifts. Watch for signals that delighters have become expectations (e.g., rising complaints when absent) and adjust priorities accordingly.
