

1. What Is Product–Market Positioning Grid (Price vs Quality, etc.)?
The Product–Market Positioning Grid is a simple visual tool that shows where products or brands sit relative to competitors along two buyer-relevant dimensions—most commonly Price and Quality, but equally applicable to attributes like Performance, Convenience, Sustainability, or Service. It’s typically drawn as a two-dimensional chart with competitors plotted as points, letting you see crowded clusters, gaps, and misalignments at a glance.
This is a marketing strategy and positioning framework within the Segmentation, Targeting & Positioning (STP) toolkit. Consultants and in-house teams use it to translate market and competitive insight into practical choices about where to compete, how to differentiate, and how to price.
In plain terms: the grid helps you decide “what position we occupy today,” “where we want to be,” and “how to move there”—by visualizing trade-offs (e.g., price for quality) the way customers do.
2. Origin and Background
Origin: Unknown; in use since at least the 1970s in marketing education and practice. The grid is closely related to perceptual mapping and to price–value “value maps” used in pricing strategy.
Why it was created: Managers needed a clear, comparable way to see how their offers stack up versus alternatives on the dimensions customers actually weigh when choosing. By compressing complex perceptions and price points into a single picture, the grid sharpens decisions about positioning, pricing, and portfolio design.
Diffusion: The approach became widespread through business school curricula, brand management playbooks, and consulting work on positioning, pricing, and portfolio strategy. It remains a staple artifact in GTM and brand strategy reviews.
3. How Product–Market Positioning Grid (Price vs Quality, etc.) Works
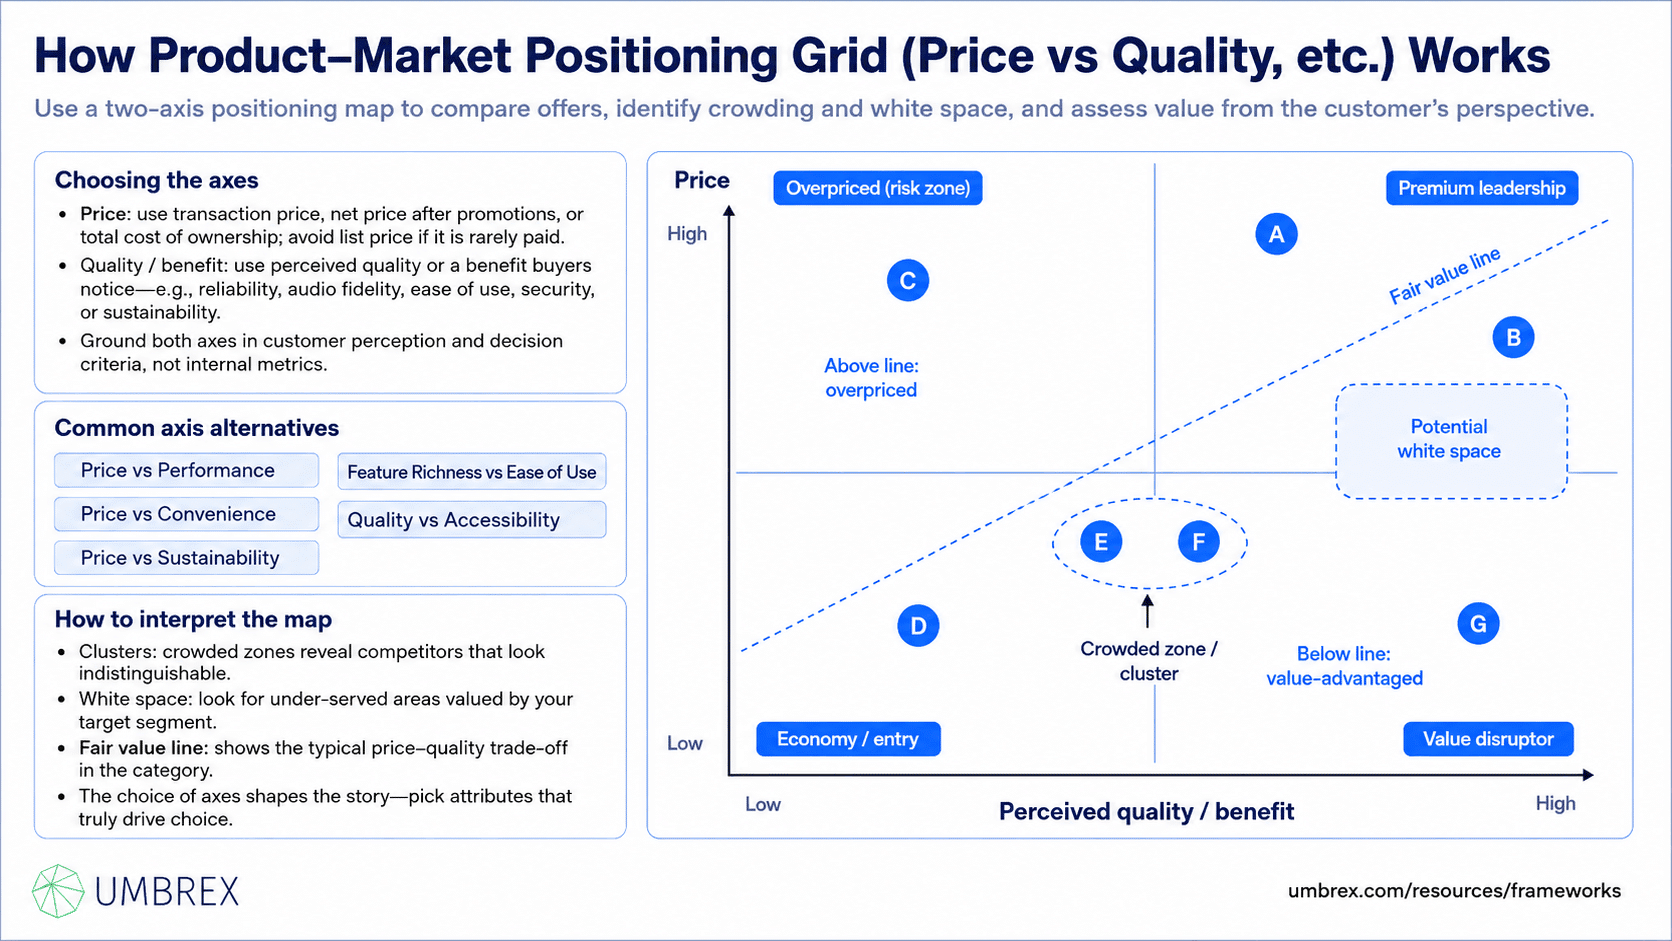
The grid’s logic is straightforward: pick two decision-driving attributes, measure each brand or product on those axes, and plot the results. The picture that emerges reveals your competitive landscape from the customer’s perspective.
Choosing the Axes
- Price: Use a customer-relevant price measure—typical transaction price, net price after promotions, or total cost of ownership (TCO) in B2B. Avoid list price if it’s rarely paid.
- Quality (or analogous benefit): Use perceived quality or benefit on a consistent scale. Depending on the category, this might be “audio fidelity,” “reliability,” “freshness,” “ease of use,” “security,” or “sustainability.” Quality should reflect what buyers actually value and notice.
While “Price vs Quality” is classic, the grid is flexible. Common alternatives include:
- Price vs Performance (e.g., processing speed, uptime, durability)
- Price vs Convenience (e.g., delivery speed, availability, ease of onboarding)
- Price vs Sustainability (e.g., carbon footprint, recyclability)
- Feature Richness vs Ease of Use (for software)
- Quality vs Accessibility (e.g., premiumization vs distribution breadth)
Plotting and Interpreting
- Clusters: Identify crowded zones where many competitors are indistinguishable. Crowding can signal a race to the bottom or the need to reposition.
- White space: Look for under-served regions valued by your target segment (e.g., mid-price but high perceived quality).
- Value line: Draw a “fair value line” (sometimes called a value equivalence line) reflecting the typical trade-off between price and perceived quality in the category. Offers above the line may be overpriced for their perceived quality; those below may be value-advantaged.
- Quadrant logic (Price vs Quality example):
- High Price / High Quality: Premium leadership
- Low Price / Low Quality: Economy/entry
- High Quality / Low Price: Value disruptor
- High Price / Low Quality: Overpriced (risk zone)
Two important notes: first, axes should be grounded in customer perception and decision criteria, not internal metrics. Second, the choice of axes guides the story—pick attributes that truly drive choice for your defined segment and use case.
4. When to Use the Product–Market Positioning Grid
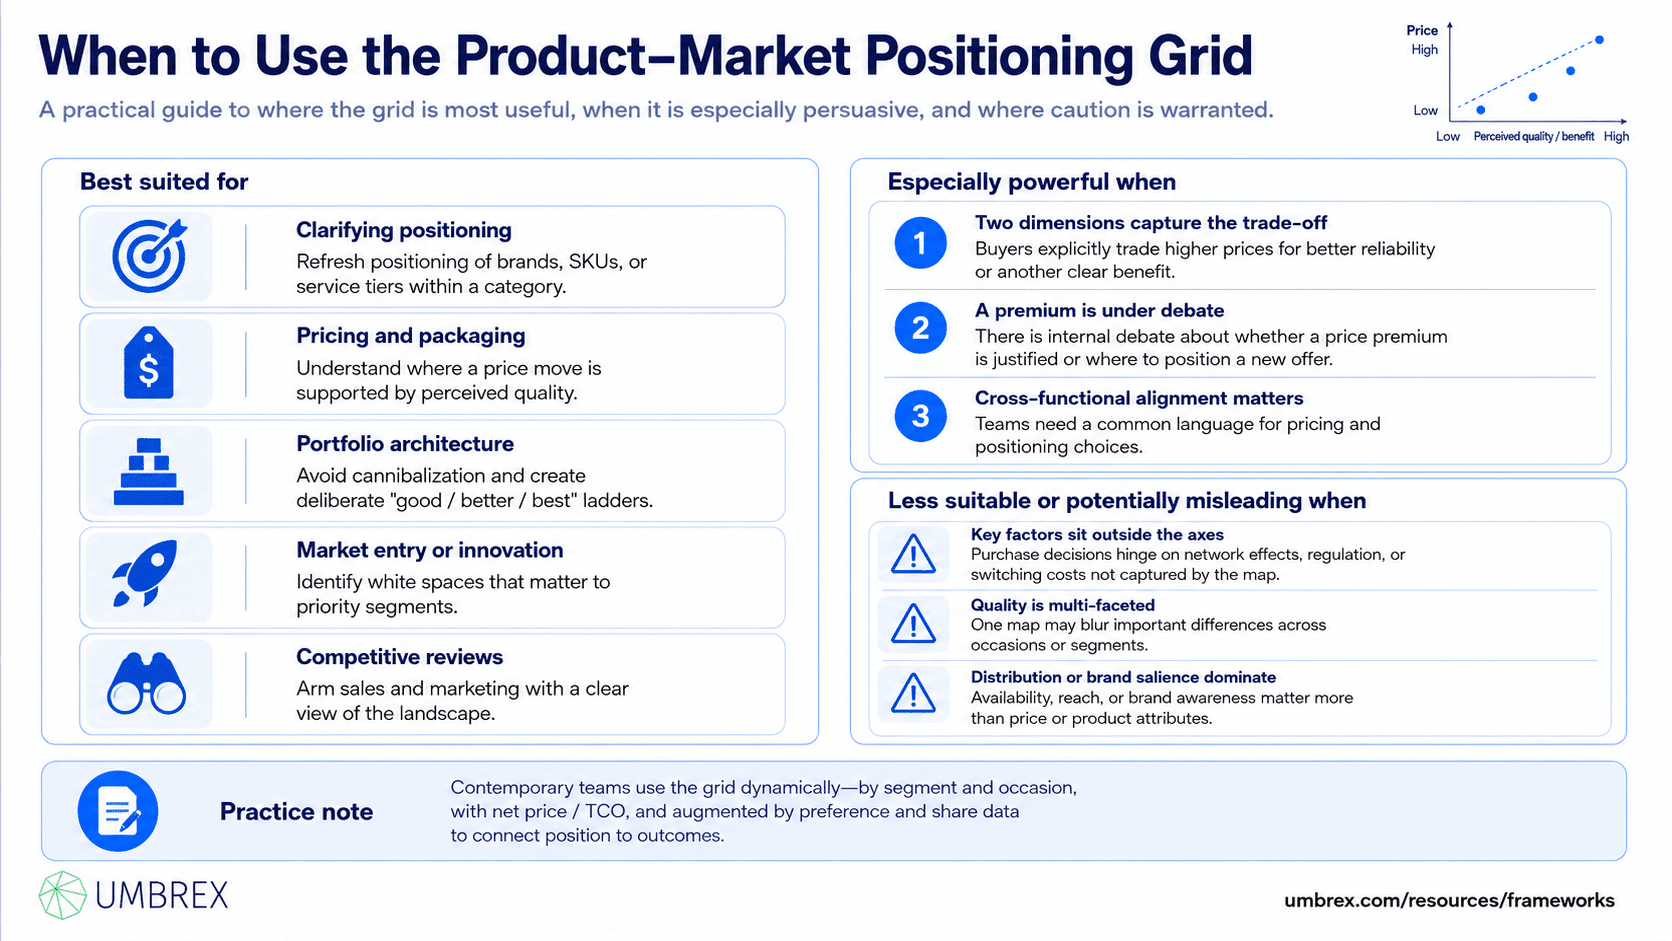
Best suited for:
- Clarifying or refreshing positioning of brands, SKUs, or service tiers within a category.
- Pricing and packaging decisions—understanding where a price move is supported by perceived quality.
- Portfolio architecture—avoiding cannibalization and creating deliberate “good/better/best” ladders.
- Market entry or innovation—identifying white spaces that matter to priority segments.
- Competitive reviews—arming sales and marketing with a clear view of the landscape.
Especially powerful when:
- Your category’s trade-offs can be sensibly captured in two dimensions (e.g., buyers explicitly trade higher prices for better reliability).
- There’s internal debate about whether a price premium is justified or about where to position a new offer.
- You need a common language for cross-functional teams to align around pricing and positioning choices.
Less suitable or potentially misleading when:
- Purchase decisions hinge on multi-sided network effects, regulation, or switching costs not captured by the axes.
- “Quality” is highly multi-faceted and varies by occasion or segment (one map may blur important differences).
- Distribution, availability, or brand salience dominate choices more than product attributes or price.
Practice note: Contemporary teams use the grid dynamically—by segment and occasion, with net price/TCO, and augmented by preference and share data to connect position to outcomes.
5. How to Apply the Product–Market Positioning Grid: Step-by-Step
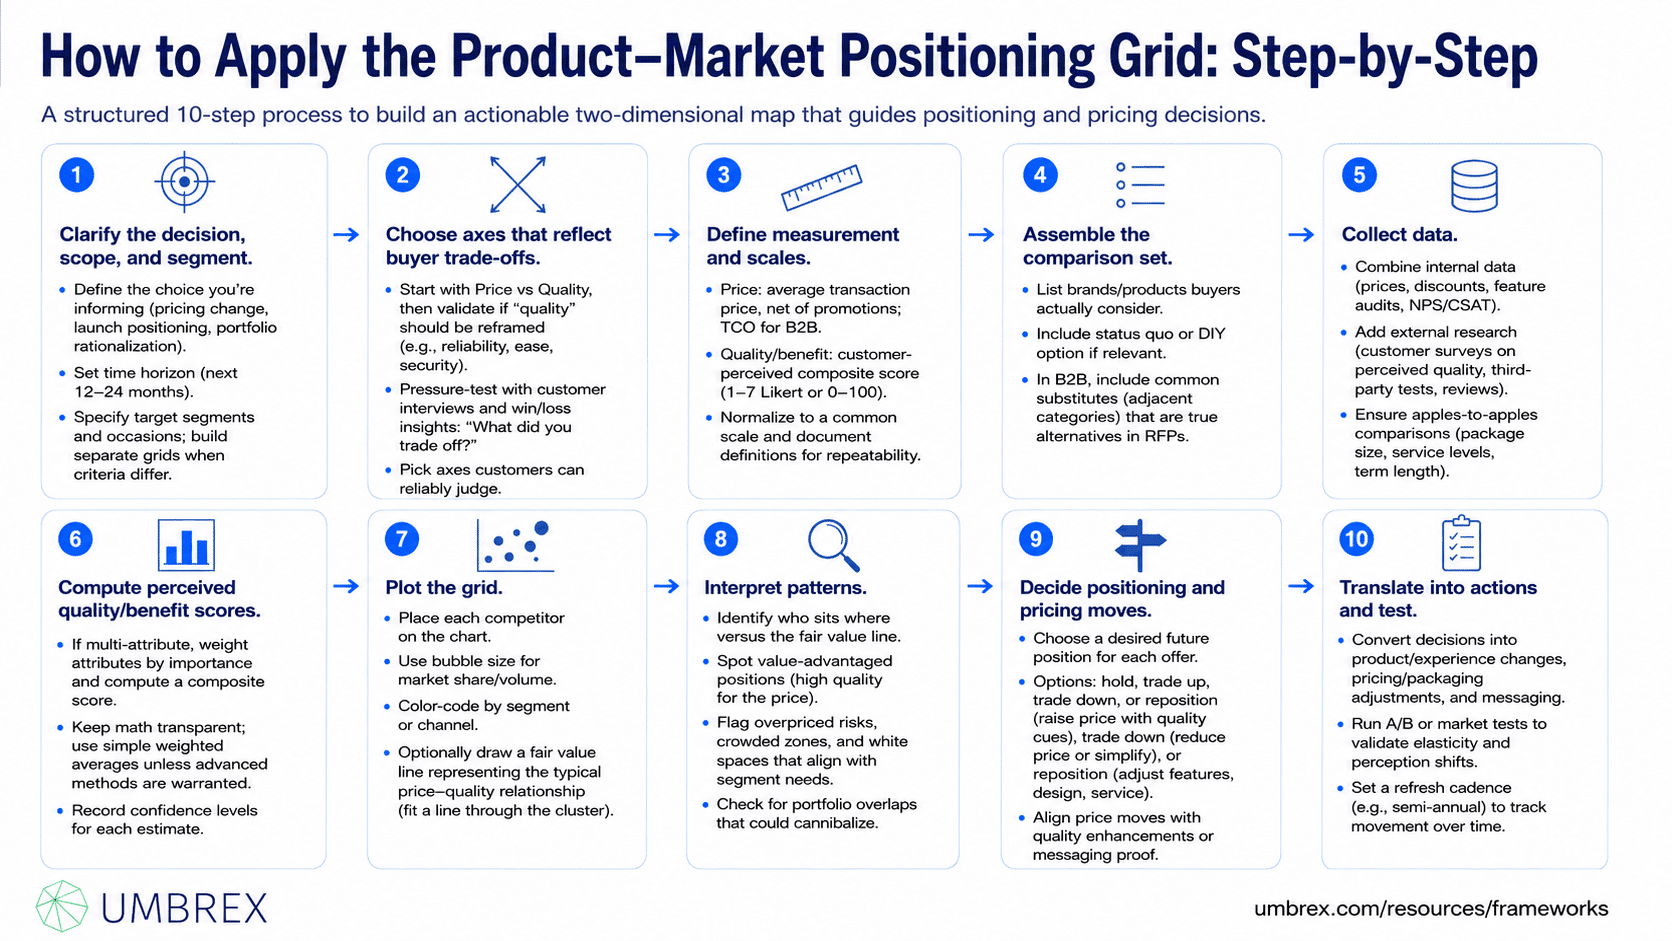
- Clarify the decision, scope, and segment.
Define the choice you’re informing (pricing change, launch positioning, portfolio rationalization) and the time horizon (next 12–24 months). Specify target customer segments and occasions; build separate grids when decision criteria differ materially.
- Choose axes that reflect buyer trade-offs.
Start with Price vs Quality, then validate if “quality” should be reframed (e.g., reliability, ease, security). Pressure-test with customer interviews and win/loss insights: “What did you trade off?” Pick axes that customers can reliably judge.
- Define measurement and scales.
For price, use average transaction price, net of promotions; for B2B, use TCO over a relevant period. For quality/benefit, use a composite of customer-perceived attributes collected via survey (e.g., 1–7 Likert) or external benchmarks; normalize to a common 0–100 or 1–5 scale. Document definitions to ensure repeatability.
- Assemble the comparison set.
List the brands/products buyers actually consider, including the status quo or DIY option if relevant. In B2B, include common substitutes (adjacent categories) if they are true alternatives in RFPs.
- Collect data.
Combine internal data (transaction prices, discounts, feature audits, NPS/CSAT) with external research (customer surveys on perceived quality, third-party tests, reviews). For price, ensure apples-to-apples comparisons (package size, service levels, term length).
- Compute perceived quality/benefit scores.
If “quality” is multi-attribute, weight attributes by importance and compute a composite score. Keep the math transparent; use simple weighted averages unless advanced methods (e.g., factor analysis) are warranted. Record confidence levels for each estimate.
- Plot the grid.
Place each competitor on the chart. Use bubble size for market share or volume; color-code by segment or channel. Optionally draw a fair value line representing the typical price–quality relationship (fit a line through the cluster).
- Interpret patterns.
Identify who sits where versus the fair value line. Spot value-advantaged positions (high quality for the price), overpriced risks, crowded zones, and white spaces that align with segment needs. Check for portfolio overlaps that could cannibalize.
- Decide positioning and pricing moves.
Choose a desired future position for each offer: hold, trade up (raise price with quality cues), trade down (reduce price or simplify), or reposition (adjust features, design, service). Align price moves with quality enhancements or messaging proof to maintain credibility.
- Translate into actions and test.
Convert decisions into product/experience changes (feature upgrades, quality signals, packaging), pricing/packaging adjustments, and messaging. Run A/B or market tests to validate elasticity and perception shifts. Set a refresh cadence (e.g., semi-annual) to track movement over time.
6. Example: Product–Market Positioning Grid in Action
Company: “NovaAudio,” an $800M consumer electronics firm focusing on headphones and earbuds across North America and Europe.
Problem: Growth had stalled. NovaAudio’s flagship over-ear model was priced at $349 but perceived as “mid-tier” in audio forums and retail reviews. Competitors clustered at $299–$399 with strong brand pull, while sub-$199 disruptors were improving fast.
Applying the framework:
- Axes: Price (street price) vs Perceived Audio Quality (composite of independent tests and consumer ratings), cut by the “commuter” and “home listening” occasions.
- Data: 1,200 survey responses across segments, third-party lab measures (frequency response, distortion), retail price scraping, and review sentiment analysis. Quality attributes weighted by importance: soundstage (30%), clarity (25%), comfort (20%), ANC performance (15%), build (10%).
- Plot: The $349 flagship landed slightly below the fair value line—priced above its perceived quality cluster. A white space emerged at ~$299 with perceived quality comparable to $399 peers, especially valued by “home listening” users.
Insights: NovaAudio suffered from weak credibility cues (materials, tuning pedigree) and packaging that did not signal premium. The “value audiophile” position (high quality at mid price) was open and aligned with the home listening occasion where brand badges mattered less than performance.
Decisions and actions: The team repositioned the flagship to $299, upgraded driver materials and ANC firmware, and refreshed industrial design with visible quality cues (metal yokes, fewer seams). Messaging shifted to lab-verified performance with third-party seals. A “Studio Series” sub-brand signaled the new position. Retail partners were armed with side-by-side demo content.
Outcomes: Within two quarters, the model moved closer to the fair value line with improved perceived quality. Unit volume rose 28%, and gross margin dollars increased despite lower price due to higher sell-through and reduced promo spend. The grid became a standing artifact in quarterly line reviews, guiding future launches to occupy distinct, defensible positions.
7. Strengths and Limitations
Strengths
- Clarity at a glance: Compresses complex competitive dynamics into a picture that accelerates alignment and decision-making.
- Direct line to pricing and positioning: Ties perceived benefit to price, highlighting where premiums are justified and where value gaps exist.
- Portfolio discipline: Helps design coherent “good/better/best” ladders and reduces self-cannibalization.
- Flexible: Works across B2C and B2B with different axis choices tailored to the segment and use case.
Limitations
- Oversimplification: Two dimensions can’t capture all drivers (distribution, brand salience, ecosystem lock-in).
- Measurement sensitivity: Results hinge on how “quality” and “price” are measured; list price or internal quality metrics can mislead.
- Static snapshot: The grid can go stale quickly as competitors move, promotions shift, or perceptions change.
- Correlation vs causation: Being “below the fair value line” correlates with value advantage but doesn’t guarantee preference or profitability.
8. Common Pitfalls (and How to Avoid Them)
- Using list price instead of what customers actually pay.
What goes wrong: Promotions and discounts distort relative value; you misjudge your premium.
How to avoid: Use net transaction price or TCO; adjust for bundle effects and financing.
- Equating internal specs with perceived quality.
What goes wrong: You score “quality” high based on lab metrics customers don’t notice.
How to avoid: Weight attributes by customer importance; validate with surveys, reviews, and win/loss data.
- Mixing segments and occasions on one map.
What goes wrong: Real trade-offs blur; you chase a position that no one segment values.
How to avoid: Build separate grids by segment/occasion where decision drivers differ.
- Ignoring package size and service levels.
What goes wrong: Apparent under/over-pricing is just different volumes or SLAs.
How to avoid: Normalize to unit price/equivalent service; ensure apples-to-apples comparisons.
- Over-interpreting the fair value line.
What goes wrong: Treating it as a law rather than a descriptive trend; making aggressive price cuts without proof.
How to avoid: Use it as a guide; test moves with experiments and watch unit economics.
- Forgetting the role of brand and distribution.
What goes wrong: You underweight awareness, shelf, and channel power that justify premiums.
How to avoid: Overlay market share, distribution breadth, or brand strength metrics to contextualize the grid.
- Set-and-forget.
What goes wrong: The grid becomes outdated; competitors reposition while you fly blind.
How to avoid: Refresh semi-annually or after major moves; keep a version history and track migration over time.
9. How the Product–Market Positioning Grid Relates to Other Frameworks
- STP (Segmentation, Targeting, Positioning): Use segmentation to identify distinct groups and their decision drivers; the grid visualizes competitive positions for those groups; then codify your choice with a positioning statement.
- Perceptual Mapping: A broader technique that can use many attributes and statistical methods (e.g., factor analysis, MDS). The Product–Market Positioning Grid is a pragmatic, two-attribute version focused on decision levers like Price and Quality.
- Value Maps and Value-Based Pricing: Pricing frameworks plot Price vs Perceived Value with a fair value line; highly complementary for setting and defending price.
- Conjoint/Discrete Choice: Quantifies how customers trade attributes and price; use conjoint to validate whether moving to a new position will increase preference and justify price changes.
- Blue Ocean Strategy (Strategy Canvas): If you seek to redefine category attributes, the strategy canvas helps decide which factors to raise, reduce, create, or eliminate; the grid then shows your resulting position versus incumbents.
- Price Waterfall: When net price varies widely, the price waterfall clarifies leakages from list to pocket price—critical context for the grid’s price axis.
- Jobs-to-be-Done (JTBD): JTBD research informs which “quality” dimensions matter for each segment and occasion.
Choice guidance: Use JTBD and research to identify valued attributes; use the grid to visualize today’s and desired positions; use conjoint and value-based pricing to quantify choices and set prices; then activate with positioning statements and messaging frameworks.
10. Key Takeaways
- The Product–Market Positioning Grid plots competitors on two buyer-relevant dimensions—often Price and Quality—to reveal clusters, gaps, and value positions.
- Choose axes grounded in customer decision criteria and measure them the way customers experience them (net price/TCO and perceived quality).
- Use the fair value line to spot over/under-valued offerings, but validate changes with testing and unit economics.
- Build separate grids by segment or occasion and refresh regularly to reflect market movement.
- Translate insights into concrete pricing, product, and messaging moves—and align portfolio roles (good/better/best) to avoid cannibalization.
- The grid complements perceptual mapping, value-based pricing, and conjoint—use them together to move from picture to prediction to action.
11. FAQs About the Product–Market Positioning Grid
Is the Product–Market Positioning Grid still relevant today?
Yes. In crowded markets, clarity about relative value is essential. The grid remains a fast, shared way to align leadership on where you stand and where to go. Modern practice enhances it with net price/TCO, segment cuts, and refresh cycles.
How is this different from a generic perceptual map?
Perceptual maps can involve many attributes and statistical reductions; the Product–Market Positioning Grid is a focused two-attribute map—often Price vs Quality—chosen for their direct link to purchase decisions and pricing.
How do we quantify “quality” credibly?
Combine customer-perceived ratings with objective indicators that buyers notice (e.g., independent tests, reliability rates). Weight attributes by importance for the target segment. Keep the scoring transparent and consistent over time.
Can B2B companies use this?
Absolutely. Replace “Price” with TCO (including implementation, training, maintenance) and “Quality” with the benefit that drives buying (e.g., uptime, throughput, compliance). Build separate grids for distinct buying centers or verticals.
Should the axes always be Price and Quality?
No. Use the two attributes that best capture the real trade-offs for your target. In software, “Ease of Use vs Feature Depth” may be more informative; in services, “Responsiveness vs Expertise.” Ensure axes are customer-relevant and measurable.
How often should we refresh the grid?
At least semi-annually, and after major launches or price changes—yours or competitors’. For volatile categories or active promotional environments, quarterly is prudent.
