

1. What Is Segmentation Attractiveness / Fit Matrix?
The Segmentation Attractiveness / Fit Matrix is a practical, visual tool for deciding which customer segments to target. It plots potential segments on a simple two-by-two grid, with segment attractiveness on one axis and your company’s ability to win (fit) on the other. Segments that are both attractive and a strong fit become priority targets; those that are low on either dimension are deprioritized or treated as longer-term options.
This is a marketing strategy framework, most often used within segmentation, targeting, and positioning (STP). It is common in consulting and corporate marketing because it forces a fact-based conversation about trade-offs, investment focus, and where the business can create and capture value.
In plain terms: the matrix helps you decide “where to play” and “where we can win” at the level of specific customer segments, whether defined by needs, behaviors, demographics, firmographics, occasions, or use cases.
2. Origin and Background
Origin: Unknown; in use since at least the 1990s. The approach is closely related to the GE/McKinsey Portfolio Matrix (industry attractiveness vs. business unit strength) and is commonly taught in marketing curricula and used by consulting firms. It adapts those portfolio concepts to customer segmentation decisions.
The matrix was created to address a recurring problem: companies often identify many possible segments but lack a disciplined, comparable way to prioritize them. By codifying “attractiveness” and “fit” into explicit criteria and weights, the tool brings structure to targeting decisions and resource allocation.
Its diffusion owes much to business school courses on STP, practitioner handbooks in product management, and widespread consulting use in go-to-market strategy, new product launches, and portfolio focus efforts.
3. How Segmentation Attractiveness / Fit Matrix Works
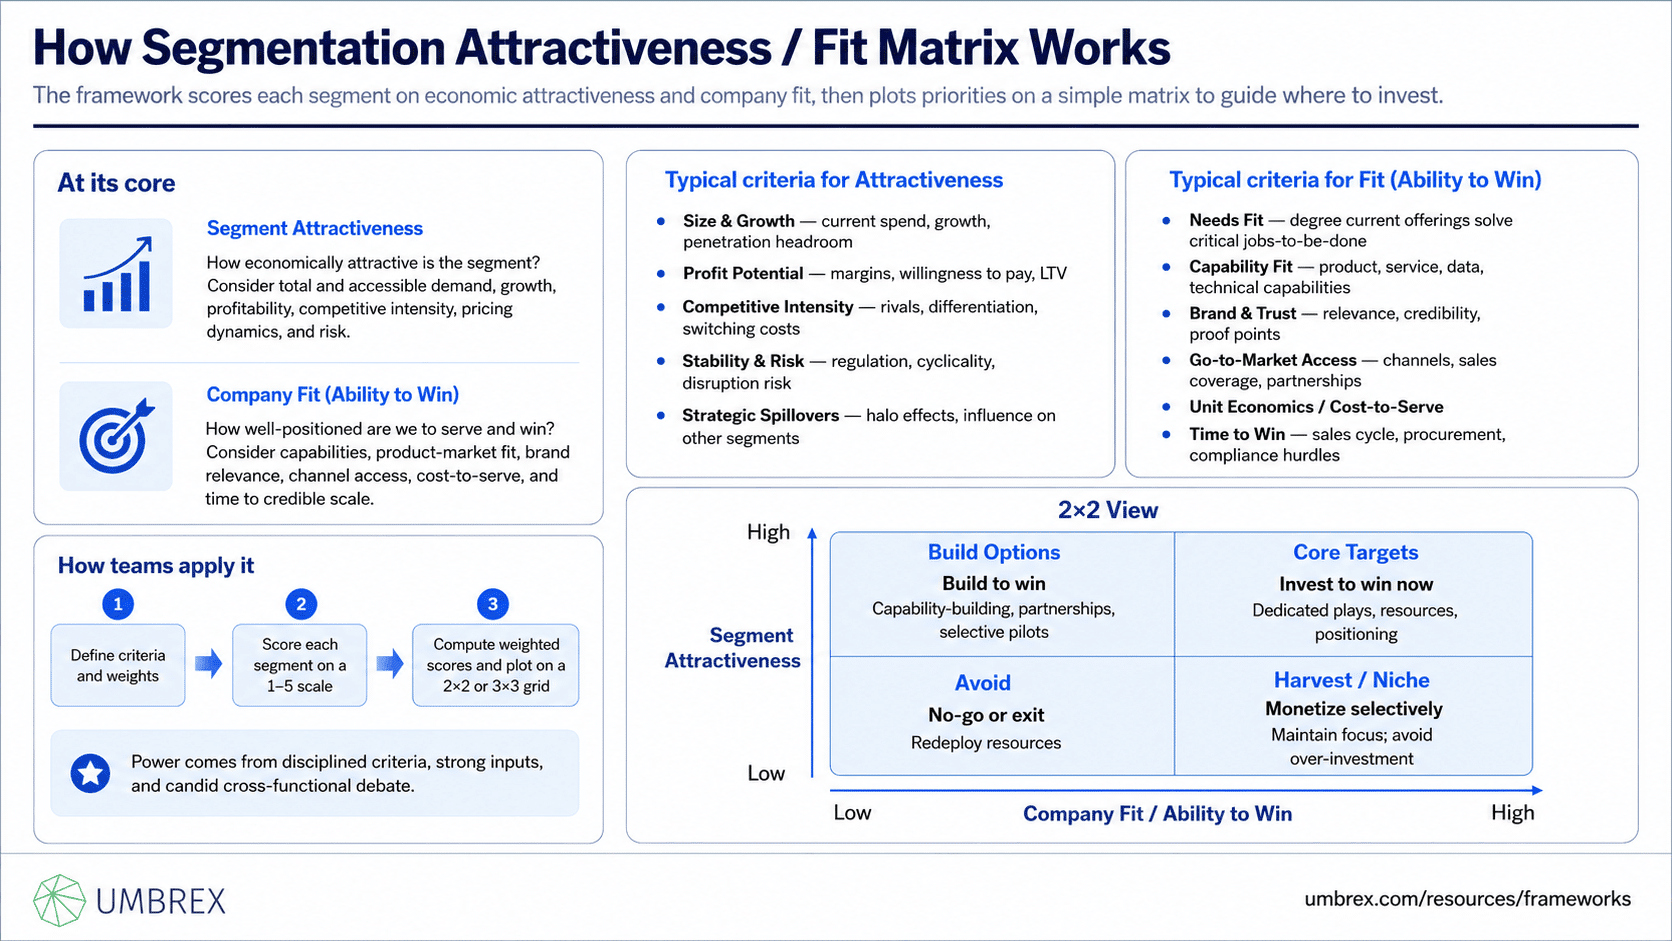
At its core, the framework compares two dimensions for each candidate segment:
- Segment Attractiveness: How economically attractive is the segment? Consider total and accessible demand, growth, profitability, competitive intensity, pricing dynamics, and risk.
- Company Fit (Ability to Win): How well-positioned are we to serve and win in the segment? Consider capabilities, product-market fit, brand relevance, channel access, cost-to-serve, and time to credible scale.
Each dimension is operationalized through a set of criteria, each with a clear definition and weight. Teams score every segment against these criteria using a consistent scale (e.g., 1–5), then compute weighted scores for both attractiveness and fit. Segments are then plotted on a 2×2 or 3×3 grid to visualize priorities.
Typical Criteria for Attractiveness
- Size and Growth: Current spend and growth rate for the segment; headroom for penetration.
- Profit Potential: Average margins, price elasticity, willingness to pay, and LTV potential.
- Competitive Intensity: Number and strength of competitors, degree of differentiation, switching costs.
- Stability and Risk: Regulatory risk, cyclicality, concentration risk, technology disruption risk.
- Strategic Spillovers: Influence on other segments, network effects, halo benefits.
Typical Criteria for Fit (Ability to Win)
- Needs Fit: Degree to which current offerings solve critical jobs-to-be-done for the segment.
- Capability Fit: Product features, service model, data, and technical capabilities required.
- Brand and Trust: Relevance, credibility, and proof points in the segment.
- Go-to-Market Access: Channel presence, sales coverage, partnerships, and distribution economics.
- Unit Economics and Cost-to-Serve:</b Cost to acquire, onboard, support; expected LTV/CAC.
- Time to Win: Sales cycle length, procurement hurdles, certification or compliance requirements.
The 2×2 View
- High Attractiveness / High Fit (Core Targets): Invest to win now—dedicated plays, resources, and positioning.
- High Attractiveness / Low Fit (Build Options): Consider capability-building, partnerships, or selective pilots.
- Low Attractiveness / High Fit (Harvest/Niche): Maintain or selectively monetize; avoid over-investment.
- Low Attractiveness / Low Fit (Avoid): No-go or exit; redeploy resources.
While the visualization is simple, the power lies in the disciplined criteria, the quality of the inputs, and the candid debate it enables across marketing, sales, product, finance, and operations.
4. When to Use Segmentation Attractiveness / Fit Matrix
Best suited for:
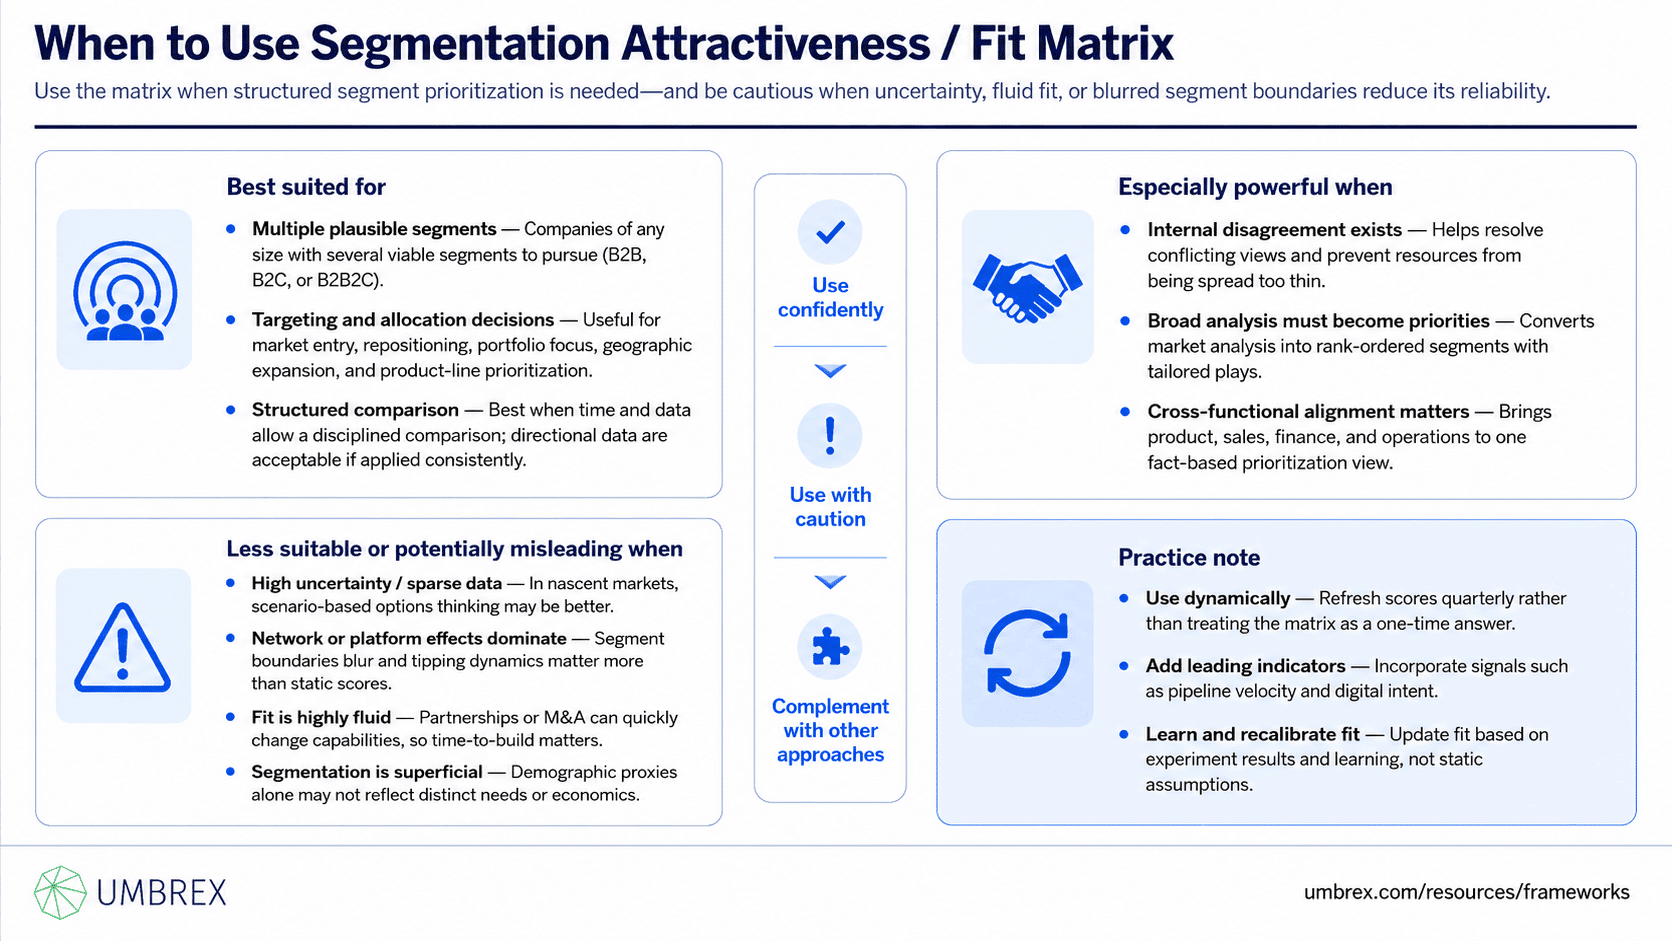
- Companies of any size that have multiple plausible segments to pursue (B2B, B2C, or B2B2C).
- Decisions about targeting and resource allocation: new market entry, repositioning, portfolio focus, geographic expansion, or product-line prioritization.
- Situations where time and data allow for a structured comparison (weeks rather than hours; directional data are acceptable if consistent).
Especially powerful when:
- There is internal disagreement about where to focus, or a risk of spreading resources too thin.
- You need to translate broad market analysis into concrete, rank-ordered segments with tailored plays.
- Cross-functional alignment is required—product wants A, sales wants B, finance worries about C.
Less suitable or potentially misleading when:
- Markets are nascent with high uncertainty and sparse data; scenario-based options thinking may be better.
- Winning requires platform/network effects where segment boundaries blur and tipping dynamics dominate.
- Capabilities can be built quickly via partnerships or M&A; “fit” is fluid and the time dimension matters.
- Segmentation is superficial (e.g., demographic proxies that do not map to distinct needs or economics).
Practice note: The matrix remains widely used, but modern practitioners embed it in a dynamic process—refreshing scores quarterly, incorporating leading indicators (e.g., pipeline velocity, digital intent), and calibrating “fit” to reflect learning from experiments rather than static assumptions.
5. How to Apply Segmentation Attractiveness / Fit Matrix: Step-by-Step
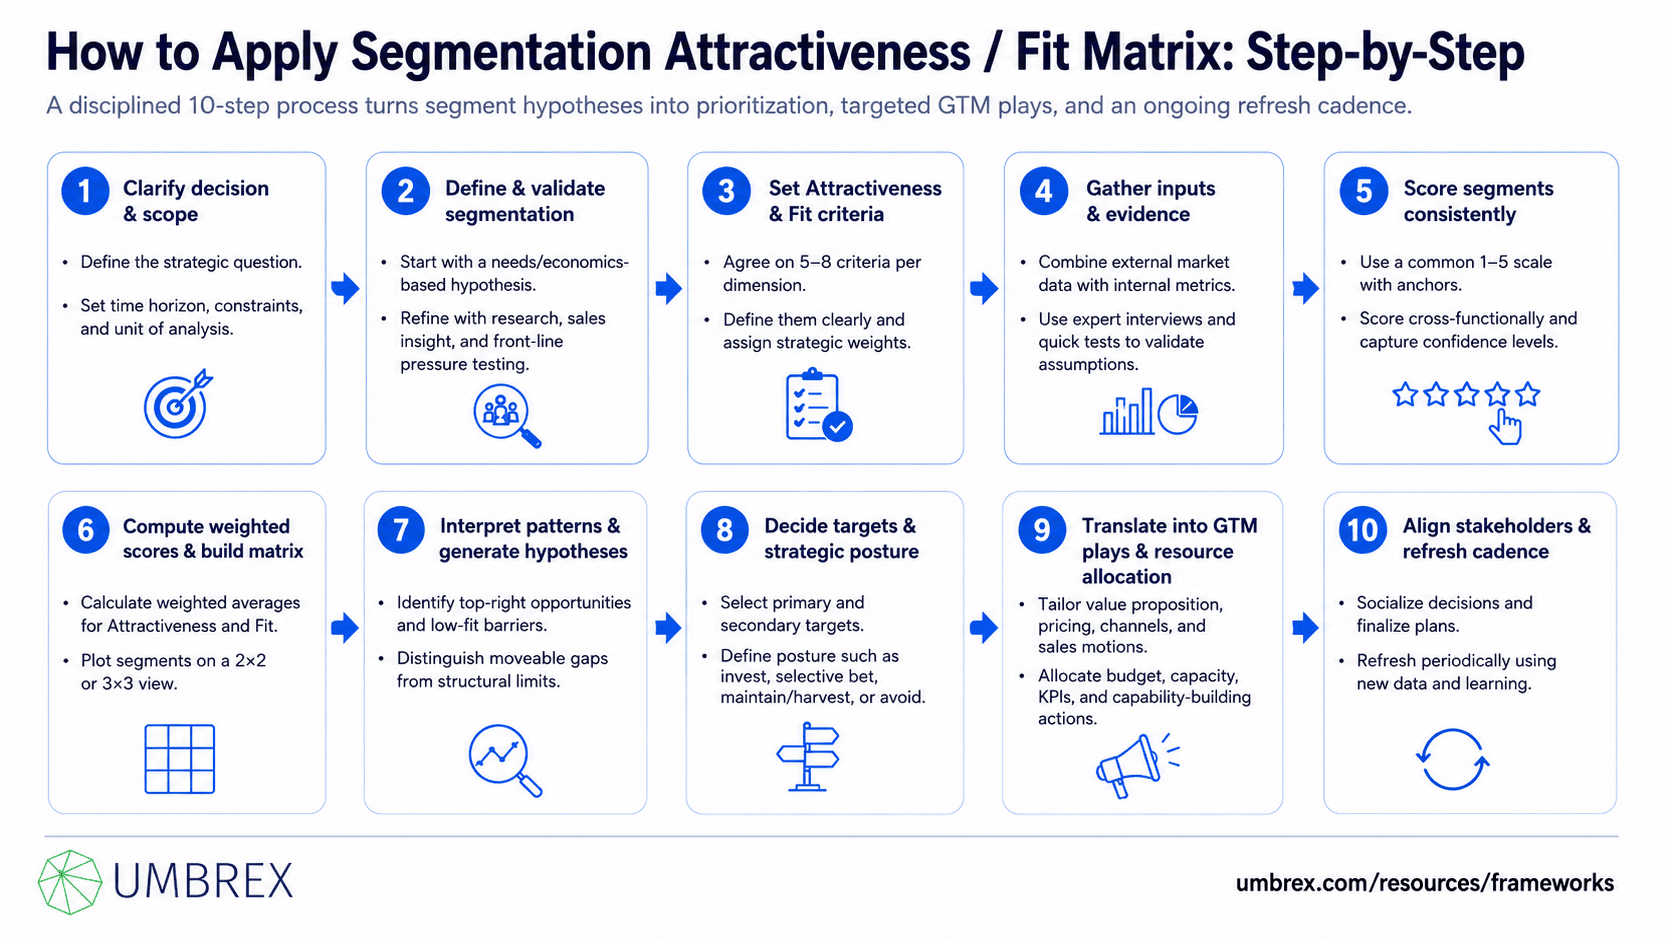
- Clarify the decision and scope.
Define the strategic question: Are you prioritizing segments for a new product, a brand repositioning, or geographic expansion? Specify the time horizon (e.g., next 12–24 months) and constraints (budget, capacity). Decide the “unit of analysis” for segments—needs-based, behavioral, firmographic, or occasion-based—and ensure consistency across the exercise.
- Define and validate the segmentation.
Start with a hypothesized segmentation that is meaningfully different in needs and economics. Use existing research, sales insights, and data clustering where available. Pressure-test with front-line teams: “Would we sell to these segments differently? Would we build different features?” Refine until the segments are mutually exclusive and collectively exhaustive for your purposes.
- Set criteria for Attractiveness and Fit (and assign weights).
Agree on 5–8 criteria per dimension. Keep definitions crisp and measurable (even if proxy-based). Assign weights that reflect your strategy (e.g., if profitability trumps growth, weight accordingly). Document the rationale to maintain consistency when revisiting the matrix later.
- Gather inputs and evidence.
Combine external data (market reports, benchmarks, competitor analysis) with internal data (win/loss, conversion rates, LTV/CAC, NPS, churn, sales cycle). Supplement with expert interviews and quick tests (landing pages, pricing experiments) to validate assumptions. Aim for “good enough to decide” rather than perfect precision.
- Score each segment consistently.
Use a common scale (e.g., 1–5) with scoring anchors (what constitutes a “5” on growth? On brand relevance?). Score collaboratively with marketing, sales, product, and finance. Capture confidence levels; low-confidence scores may trigger targeted research or experiments.
- Compute weighted scores and build the matrix.
Calculate weighted averages for Attractiveness and Fit. Plot each segment on a 2×2 (or 3×3) chart. Label each point clearly and include bubble size if you wish to represent segment size. Keep the visual simple enough to facilitate discussion.
- Interpret patterns and generate hypotheses.
Look for clusters: Which segments land in the top-right quadrant? Why do certain segments have low fit—capability gaps, channel gaps, brand issues? Identify “moveable” variables (e.g., partnerships can improve channel access quickly; core product gaps may take longer).
- Decide target segments and strategic posture.
Choose your primary and secondary targets. For each, define the posture: invest to win, selective bets, maintain/harvest, or avoid. Be explicit about stop criteria and resource implications. Tie choices back to your strategy (e.g., focus on profitable growth vs. land-grab).
- Translate into GTM plays and resource allocation.
For priority segments, craft segment-specific value propositions, pricing, messaging, channel strategy, and sales motions. Allocate budgets, capacity, and KPIs. For build-options, outline capability-building roadmaps (hires, partnerships, certifications) with milestones and stage gates.
- Align stakeholders and institute a refresh cadence.
Socialize the matrix with leadership and cross-functional teams. Incorporate feedback, finalize targets, and codify in annual/quarterly plans. Refresh scores periodically to reflect new data (pipeline velocity, win rates, LTV) and adjust priorities accordingly.
6. Example: Segmentation Attractiveness / Fit Matrix in Action
Company: “QuantisCloud,” a $500M B2B SaaS company offering analytics and ML tooling. Considering expansion beyond core technology startups into highly regulated industries in North America and Europe.
The problem: Leadership saw promising demand in three segments—mid-market healthcare providers, large financial services firms, and industrial manufacturers—but lacked clarity on where to focus sales hiring, compliance investments, and product roadmap.
Applying the framework:
- Segmentation: Defined three needs-based segments: “Clinical Insight Builders” (healthcare), “Risk Analytics Modernizers” (finance), “Factory Digitalizers” (industrial).
- Criteria: Attractiveness included segment growth, profit potential (willingness to pay), competitive intensity, and regulatory risk. Fit included product capability fit, compliance readiness (HIPAA, SOC 2, GDPR), channel access/partners, sales cycle, and LTV/CAC.
- Scoring: Finance scored highest on willingness to pay but lowest on sales cycle and compliance readiness; healthcare was moderate on attractiveness but higher on fit due to existing HIPAA-ready modules; industrial had strong channel partners but lower near-term margins.
- Matrix: Healthcare landed in the top-right (high attractiveness/high fit), finance in high attractiveness/low fit, and industrial in moderate attractiveness/high fit.
Insights: QuantisCloud could win quickly in healthcare with minimal incremental build. Finance was attractive but required a 12–18 month ramp (audit trails, model risk governance, certifications). Industrial represented a profitable niche with faster cycles via OEM partners.
Decisions and actions: The company prioritized healthcare as the primary target, funding a dedicated sales pod, reference case program, and tailored pricing. Finance became a “build option” with a sequenced compliance roadmap and two lighthouse pilots. Industrial received a partner-led motion with restrained investment. Within two quarters, healthcare pipeline tripled, sales cycles shortened by 20%, and the firm had clear milestones to reassess the finance segment.
7. Strengths and Limitations
Strengths
- Sharpens focus: Forces explicit choices among segments, reducing the tendency to chase everything.
- Clarifies trade-offs: Balances market potential against ability to win, making resource allocation more objective.
- Creates a common language: Aligns marketing, sales, product, and finance around a shared view of priorities.
- Action-oriented: Translates directly into segment plays and capability roadmaps.
- Flexible: Works with B2B and B2C, qualitative and quantitative inputs, and various segmentation schemes.
Limitations
- Static snapshot risk: Ignores dynamics if not refreshed—fit can change as capabilities are built or competitors react.
- Garbage in, garbage out: Subjective scoring or weak data can lead to false precision.
- Oversimplification: Complex interactions (spillovers, platform effects) may not fit neatly into two axes.
- Execution blind spot: The tool prioritizes “where to play,” not “how to win” in detail—requires complementary GTM planning.
8. Common Pitfalls (and How to Avoid Them)
- Misdefining segments.
What goes wrong: Segments are demographic or industry labels rather than distinct needs/economics, leading to muddled insights.
How to avoid: Use needs- or behavior-based definitions. Ask, “Would we build or sell differently to this segment?” If not, refine.
- Unbalanced or vague criteria.
What goes wrong: Criteria overlap or lack clear definitions; teams talk past each other.
How to avoid: Define each criterion with measurable anchors and avoid redundancy (e.g., keep “growth” separate from “size”).
- Subjective scoring without evidence.
What goes wrong: HiPPO opinions drive scores; later data contradicts decisions.
How to avoid: Pair expert judgment with data points (win rates, pricing tests, intent signals) and note confidence levels.
- Ignoring cost-to-serve and sales cycle.
What goes wrong: Attractive segments look great on revenue but destroy unit economics and tie up capacity.
How to avoid: Bake LTV/CAC, support intensity, and time-to-cash into the Fit dimension.
- Underweighting the time dimension.
What goes wrong: Teams treat Fit as fixed and miss build paths to high-value segments.
How to avoid: Classify segments as “win now,” “build,” or “option.” Attach capability roadmaps and milestones.
- Too many priority segments.
What goes wrong: The matrix says “focus,” but the plan funds six segments; impact gets diluted.
How to avoid: Cap near-term primary targets at 1–3, with clear investment levels and trade-off rules.
- No refresh cadence.
What goes wrong: The view goes stale; competitive moves or new data go unnoticed.
How to avoid: Set quarterly refreshes; adjust weights and scores as you learn from the market.
9. How Segmentation Attractiveness / Fit Matrix Relates to Other Frameworks
- STP (Segmentation, Targeting, Positioning): The matrix operationalizes the “T” in STP by prioritizing segments after segmentation work and before positioning and messaging.
- GE/McKinsey Portfolio Matrix: Conceptual ancestor—industry attractiveness vs. business strength. The Segmentation Attractiveness / Fit Matrix applies similar logic at the customer segment level rather than business units.
- Porter’s Five Forces: Use Five Forces to analyze industry structure and competitive dynamics that inform the Attractiveness criteria. Then use the matrix to choose specific segments.
- Jobs-to-be-Done and Value Proposition Canvas: Helpful for defining segments around needs and sharpening the Fit assessment (how well your offering solves critical jobs and pains).
- Customer Lifetime Value (CLV) and CAC analyses: Provide quantitative inputs for Profit Potential and Cost-to-Serve within Fit and Attractiveness scoring.
- TAM/SAM/SOM: Use to estimate market size (TAM) and accessible demand (SAM/SOM); these estimates feed the Attractiveness dimension.
- Conjoint, pricing experiments, and RFM/cluster analysis: Methods to quantify preferences, willingness to pay, and segment boundaries; these are upstream analytical inputs to the matrix.
When to choose which: If you’re early and exploring segment definitions, start with research methods (JTBD, clustering). When moving from understanding to prioritization and resource allocation, use the Segmentation Attractiveness / Fit Matrix. For portfolio-level capital allocation across products/businesses, the GE/McKinsey matrix is a better fit.
10. Key Takeaways
- The Segmentation Attractiveness / Fit Matrix is a simple, powerful tool to prioritize customer segments based on market potential and your ability to win.
- Define crisp criteria and weights for both dimensions, score consistently, and make the trade-offs explicit.
- Use it to drive concrete GTM plays, investment levels, and capability roadmaps—not just a slide.
- Refresh regularly; treat “fit” as dynamic and improveable, not a fixed verdict.
- Beware of superficial segments and subjective scoring; pair expert judgment with data and experiments.
- It complements STP, Five Forces, CLV/CAC analysis, and JTBD to form a robust targeting toolkit.
11. FAQs About Segmentation Attractiveness / Fit Matrix
Is the Segmentation Attractiveness / Fit Matrix still relevant today?
Yes. If anything, it’s more relevant as markets fragment and resources tighten. Modern practice emphasizes dynamic refreshes, experiment-driven inputs (e.g., pricing tests, digital intent), and explicit capability-building paths for high-potential segments with low current fit.
How is this different from the GE/McKinsey matrix?
The GE/McKinsey matrix evaluates a portfolio of businesses or products against industry attractiveness and business strength. The Segmentation Attractiveness / Fit Matrix applies analogous logic to customer segments, using criteria tuned to targeting (e.g., LTV/CAC, channel access, needs fit).
Can small or early-stage companies use this framework?
Absolutely. For startups, keep criteria few and practical (e.g., willingness to pay, sales cycle, cost-to-serve). Use directional scores and quick tests to inform choices. Limit near-term targets to one or two segments and revisit monthly or quarterly as you learn.
How long does a typical application take?
In a well-scoped project with accessible data, expect 3–6 weeks: one week to define segments and criteria, two to collect inputs and score, and one to align decisions and translate into GTM plays. Lightweight versions for fast-moving teams can be done in 1–2 weeks.
Do we need rigorous quantitative data to use it effectively?
Not always. Directional data combined with expert judgment can be sufficient, especially if you record confidence levels and run validation experiments. Over time, feed in harder metrics (win rates, LTV/CAC, churn) to improve accuracy and confidence.
