

1. What Is the Firmographic Segmentation Framework (B2B)?
Firmographic segmentation is the practice of grouping and prioritizing business customers by company attributes—such as industry, size, revenue, headcount, geography, growth rate, ownership, and operating model—so you can target, position, and sell more effectively. It is the B2B analogue to demographics in consumer markets, and a foundational element within the Segmentation, Targeting, and Positioning (STP) toolkit for business markets.
In practical terms, firmographics help you answer: Which kinds of companies should we target first? How should we organize sales coverage? What messages and offers should we lead with by segment? Where should we allocate demand-generation budget geographically and by vertical?
Consultants and B2B leaders use firmographic segmentation to size markets (TAM/SAM/SOM), define Ideal Customer Profiles (ICPs), build territory and account plans, feed lead scoring models, and underpin Account-Based Marketing (ABM) programs. On its own, it does not explain every buying decision; paired with needs, technographics, and buying-center insights, it becomes a high-ROI engine for growth.
2. Origin and Background
Origin: Unknown; in use since at least the 1970s alongside the development of industry classification systems and early business databases used for direct marketing and sales territory planning.
Why it was created: B2B marketers needed a consistent, scalable way to segment organizations—beyond anecdotes—so sales and marketing could focus on the most promising accounts and tailor efforts by vertical and company profile.
How it became widely known: through sales and marketing operations, database marketing, and the rise of customer relationship management (CRM) systems that standardized firmographic fields. Over the last two decades, data enrichment providers and ABM platforms further institutionalized firmographic segmentation as a core capability.
3. How the Firmographic Segmentation Framework Works

The logic is straightforward: company attributes correlate with needs, budget, buying processes, and adoption likelihood. By segmenting accounts on those attributes, you can align coverage, messaging, pricing, and product bundles to where there is most value and the highest right-to-win.
Common Firmographic Variables
- Industry/vertical: Industry codes (e.g., SIC/NAICS) and sub-verticals. Often the strongest signal of need, regulation, and use cases.
- Company size: Employees and/or revenue bands; sometimes assets under management, number of locations, or fleet size depending on category.
- Geography: Country/region/state; sometimes metro areas or regulatory jurisdictions (e.g., EU vs. US).
- Growth and momentum: Trailing/forward growth rates, hiring velocity, funding stage, or IPO/M&A status.
- Ownership and structure: Public vs. private, PE-backed, government/education, franchised vs. corporate, HQ vs. branch, centralized vs. decentralized operations.
- Business model and go-to-market: B2B vs. B2C, e-commerce penetration, channel reliance, field vs. inside sales, service vs. product mix.
- Regulatory/compliance regime: Heavily regulated sectors (healthcare, financial services, utilities) vs. lightly regulated—affects needs and buying friction.
- Procurement and buying-center complexity: Formal RFP cycles, vendor lists, safety/security requirements, length of approval chains.
Adjacent Lenses Often Paired with Firmographics
- Technographics: Installed technologies and stack characteristics (cloud provider, CRM/ERP, security tools). Powerful for targetability and product fit.
- Intent signals: Research and content consumption patterns indicating in-market behavior.
- Needs and use cases: Category-specific outcomes sought (speed, compliance, automation). These sharpen propositions within firmographic segments.
Typical Outputs
- 3–8 firmographic segments or tiers (e.g., “US mid-market healthcare,” “Global enterprise retail,” “VC-backed SaaS 200–1,000 employees”).
- ICPs per segment: the precise attribute combination that defines “most likely to buy and succeed.”
- Coverage and motion design: account tiering, territory models, and sales motions (field vs. inside vs. partner).
- Messaging and offer guidance by segment, including proof points and compliance language.
- Activation mapping: segments wired into CRM/CDP, marketing automation, and ABM platforms.
4. When to Use Firmographic Segmentation
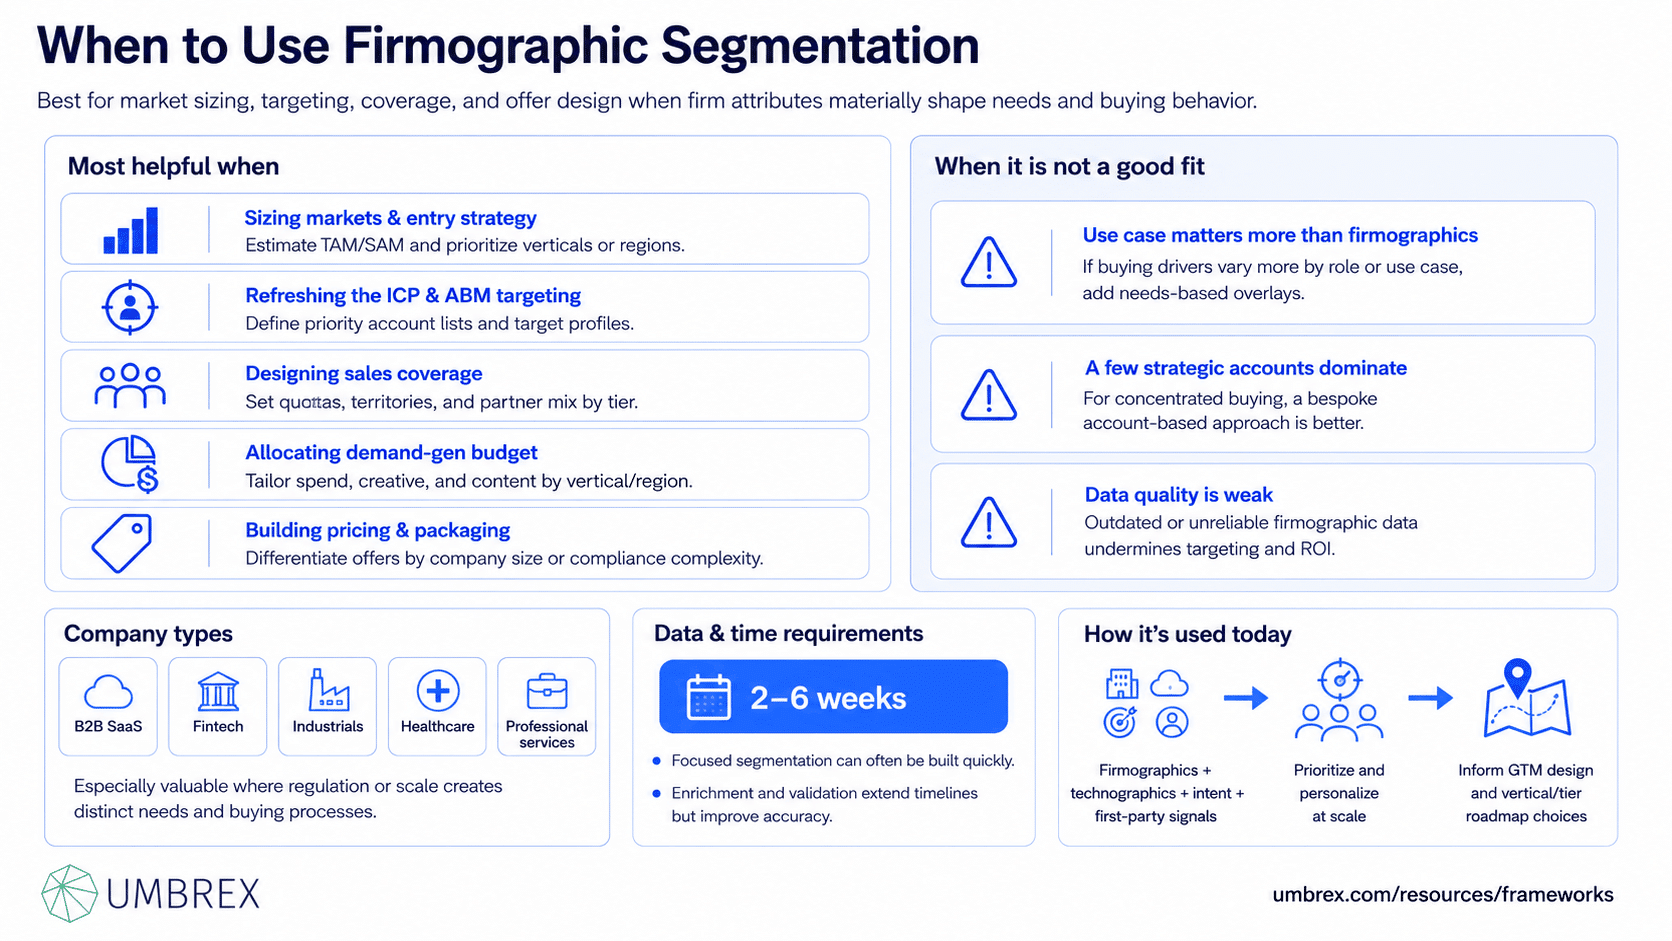
Most helpful when you are:
- Sizing markets (TAM/SAM) and building entry strategies by vertical or region.
- Defining or refreshing your ICP and constructing prioritized target account lists for ABM.
- Designing sales coverage and capacity models (quota, territories, partner mix) by account tiers.
- Allocating demand-generation budget by vertical/region and tailoring creative and content.
- Building pricing/packaging by company size or regulatory complexity (e.g., “Standard vs. Enterprise” tiers).
Company types: Applicable across B2B—SaaS, fintech, industrials, healthcare, professional services. Particularly valuable where regulation or scale drives distinct needs and buying processes.
Data and time requirements: A focused segmentation can be developed in 2–6 weeks, depending on data quality and the number of markets. Enrichment and validation can extend timelines but improve accuracy substantially.
When it is not a good fit or can mislead:
- If purchase drivers vary more by use case than by firm size/industry (e.g., a horizontal developer tool)—use needs/role-based overlays.
- When buying is concentrated among a few strategic accounts—an account-based, bespoke approach is superior to broad segmentation.
- If firmographic data are outdated or unreliable; bad data undermines targeting and ROI.
How it’s used today: Modern programs combine firmographics with technographics, intent, and first-party signals to prioritize and personalize at scale, and to inform both go-to-market design and product roadmap choices by vertical/tier.
5. How to Apply the Firmographic Segmentation Framework: Step-by-Step
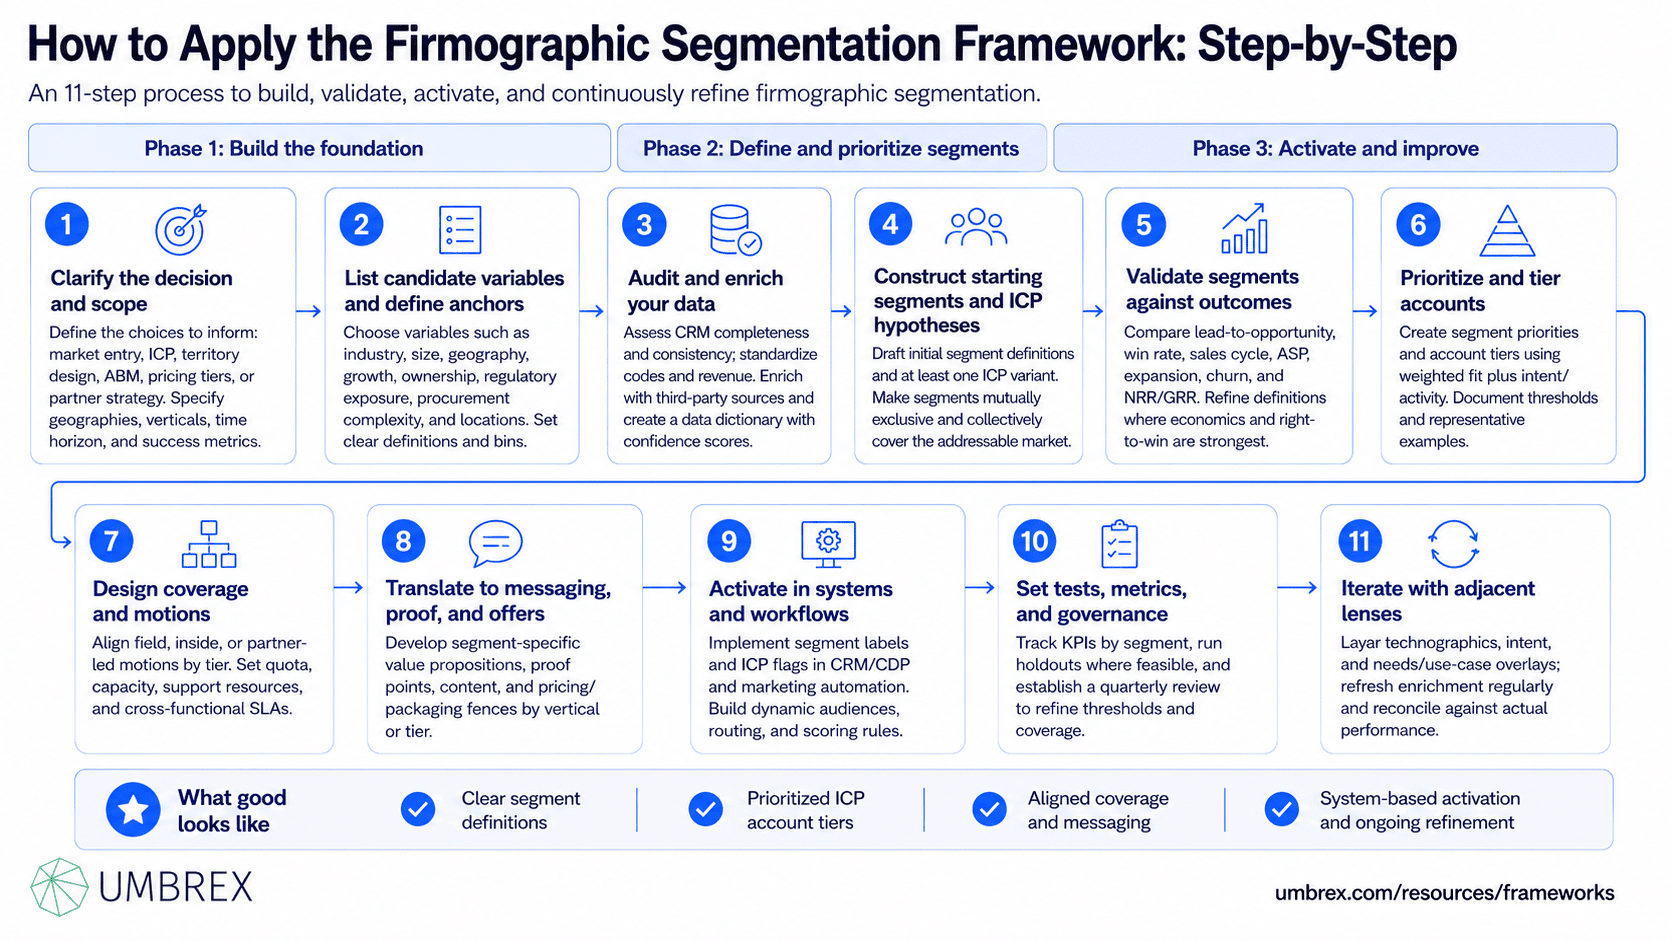
- Clarify the decision and scope
Define the choices the segmentation must inform: market entry, ICP definition, territory design, ABM targeting, pricing tiers, or partner strategy. Specify geographies, verticals, and time horizon. Align on success metrics (pipeline, win rate, ASP, payback).
- List candidate variables and define anchors
Assemble a comprehensive variable set: industry, size, geography, growth, ownership, regulatory exposure, procurement complexity, locations. Write clear definitions and bins (e.g., “mid-market = 200–1,000 employees,” “heavily regulated = requires formal compliance attestations”).
- Audit and enrich your data
Assess CRM completeness and consistency for key fields. Standardize industry codes; normalize revenue (currency, fiscal year). Enrich with reputable third-party sources to fill gaps (headcount, revenue, sub-industry, growth, funding). Create a data dictionary and confidence scores.
- Construct the starting segments and ICP hypotheses
Propose initial segment definitions and at least one ICP variant (e.g., “US healthcare providers, 500–2,000 employees, multiple sites, 10%+ growth”). Ensure each segment is mutually exclusive and collectively covers your addressable market.
- Validate segments against outcomes
Analyze historical performance by candidate segment: lead-to-opportunity rates, win rates, sales cycle, ASP, expansion, churn, NRR/GRR. Identify where economics are strongest and where the right-to-win is highest. Adjust definitions accordingly.
- Prioritize and tier accounts
Create segment prioritization and account tiers (e.g., Tier 1 strategic, Tier 2 focus, Tier 3 opportunistic) using a weighted score of fit (firmographics + technographics) and intent/activity. Document thresholds and examples.
- Design coverage and motions
Align sales motions to segments/tiers: field vs. inside vs. partner-led; SDR ratios; quota and capacity by territory. For regulated/complex segments, allocate solution consultants and compliance support. Codify SLAs across marketing, SDR, and AE teams.
- Translate to messaging, proof, and offers
Draft segment-specific value propositions, proof points (customer references, certifications), and pricing/packaging fences (e.g., advanced security features for enterprise/regulatory segments). Tailor content and events by vertical.
- Activate in systems and workflows
Implement segment labels and ICP flags in CRM/CDP and marketing automation. Build dynamic account lists and audiences for ABM and paid media. Integrate with lead routing and scoring—prioritize ICP leads and high-intent accounts within priority segments.
- Set tests, metrics, and governance
Define KPIs by segment (pipeline, win rate, ASP, CAC payback). Run geo/segment holdouts where feasible. Establish a quarterly review to refine segments, thresholds, and coverage based on performance and market shifts.
- Iterate with adjacent lenses
Layer technographics and intent to refine target lists; add needs/use-case overlays to sharpen messaging within segments; refresh enrichment periodically and reconcile against actuals.
6. Example: Firmographic Segmentation in Action
Context: A $300M cybersecurity SaaS company plans to accelerate growth in North America and Western Europe. Historically enterprise-focused, it sees strong inbound from mid-market accounts but inconsistent conversion. Leadership needs to redefine ICPs, redesign coverage, and focus demand-gen on the highest-return segments.
Approach: A 6-week firmographic segmentation program with enrichment and performance validation.
- Variables: Industry (and sub-vertical), employees (bands), regions, growth rate, funding status, number of locations, regulatory exposure (health/finance/critical infrastructure), procurement complexity (formal security/compliance requirements).
- Data: CRM normalization, third-party enrichment for headcount/revenue and sub-industry, intent overlays.
- Initial segments:
– Regulated Mid-Market (healthcare and financial services, 200–1,000 employees)
– Distributed Retail/Consumer (multi-location, 500–5,000 employees)
– VC-Backed SaaS (100–1,000 employees, high growth)
– Global Enterprise (5,000+ employees)
- Validation: Prior-year analysis showed highest win rates and fastest cycles in Regulated Mid-Market (compliance-fit messaging, ASP $180k, 25% win rate); the Global Enterprise segment had large deals but long cycles and heavy pre-sales load.
Decisions and actions:
- ICP and prioritization: Primary ICP = Regulated Mid-Market and VC-Backed SaaS in US/UK/DE. Tier 1 account lists assembled with technographic filters (cloud provider + EDR stack) and high-intent signals.
- Coverage: New hybrid model—field AEs for Tier 1, inside sales for Tier 2, partner-led for distributed retail. Added dedicated solutions consultants for regulated segments.
- Messaging and offers: Compliance-forward messaging for healthcare/finance with third-party attestations; “fast time-to-value with modern stack” for VC-Backed SaaS. Enterprise features fenced to higher tiers; mid-market bundles with rapid deployment packaged.
- Activation: ICP flags in CRM; lead scoring weighted for ICP + intent; ABM plays in target metros; vertical webinars with customer references; SDR cadences tailored by vertical.
Outcomes (two quarters): Pipeline from primary ICP segments +41%; win rate +6 points; sales cycle −18%. ASP held steady due to fenced feature tiers. Marketing reallocated 25% of spend from low-conversion enterprise plays to ICP ABM, improving CAC payback by ~20%.
7. Strengths and Limitations
Strengths
- Clarity and focus: Aligns sales, marketing, and product around where to hunt and how to cover the market.
- Scalable and actionable: Easily operationalized in CRM and ABM platforms; supports territory design and account tiering.
- Predictive in B2B: Company size, industry, and regulation reliably correlate with needs, budget, and buying processes.
- Foundation for ICP and ABM: Provides the backbone for target account selection and tailored plays.
Limitations
- Not the whole story: Firmographics explain “who and where,” not full “why”; needs, technographics, and intent enrich precision and creative.
- Data quality sensitivity: Misclassified industry codes or outdated headcount will misdirect spend and coverage.
- Static if not refreshed: M&A, funding, and hiring spur rapid change; quarterly updates are essential in fast-moving spaces.
- Over-binning risk: Too many micro-segments create complexity without incremental ROI.
8. Common Pitfalls (and How to Avoid Them)
- Over-reliance on raw industry codes
What goes wrong: Broad codes hide sub-vertical nuances; misclassification is common.
Avoid: Create practical sub-vertical groupings; validate with website language and product lines.
- Using revenue instead of the right size proxy
What goes wrong: Services-heavy firms look “small” on headcount but are large revenue; misfit for user-based pricing.
Avoid: Choose the size metric aligned to your economics (employees, workloads, locations).
- Ignoring buying-center complexity
What goes wrong: Same firmographic segment, very different decision processes; cycle times slip.
Avoid: Add procurement complexity and role maps as attributes; tailor motions accordingly.
- Stale or inconsistent data
What goes wrong: Old headcount and legacy codes drive poor routing and targeting.
Avoid: Quarterly enrichment; standardize picklists; enforce data validation at entry.
- Too many segments
What goes wrong: Execution fragments; teams lose focus.
Avoid: 3–8 segments with 1–3 primary ICPs; design scalable plays before adding nuance.
- No linkage to outcomes
What goes wrong: Segment choices ignore win rate, ASP, and payback; resources misallocated.
Avoid: Validate against historical performance; set segment-level KPIs.
- Missing technographic/intent overlays
What goes wrong: You target right firms at the wrong time or with the wrong message.
Avoid: Layer stack signals and in-market intent; prioritize sequencing.
9. How Firmographic Segmentation Relates to Other Frameworks
- STP (Segmentation–Targeting–Positioning): Firmographics supply the initial segmentation; Targeting selects priority segments and ICPs; Positioning tailors value propositions and proof by vertical/tier.
- Ideal Customer Profile (ICP): An ICP is a precise, high-probability slice of firmographics (often plus technographics and intent). Firmographic segmentation defines the space; ICP identifies the bullseye.
- Needs-Based/Use-Case Segmentation: Explains why accounts within a firmographic segment buy. Use it to tailor messaging and product within vertical/tier.
- Technographic Segmentation: Complements firmographics by indicating product fit and switching cost; together they sharpen account selection and creative.
- Lead Scoring and CLV Models: Firmographic features are strong predictors in scoring; CLV by segment informs budget and coverage.
- ABM and Territory Design: Firmographic segments and tiers underpin account list building, territory carving, and partner strategy.
- TAM/SAM/SOM Sizing: Firmographics are the basis for market sizing by vertical, size band, and geography.
Choosing tools: Start with firmographics to define where to play; add needs and technographics to decide how to win; use intent for timing; apply ICP and ABM for execution.
10. Key Takeaways
- Firmographic segmentation groups business customers by company attributes that correlate with need, budget, and buying process.
- It is essential for ICP definition, ABM targeting, territory design, pricing tiers, and budget allocation.
- Keep segments practical: 3–8, validated against win rate, ASP, and cycle time; designate 1–3 primary ICPs.
- Data quality matters—standardize, enrich, and refresh quarterly; pair with technographics, intent, and needs overlays.
- Translate segments into coverage motions, messaging, and offers; wire segment labels into CRM/marketing systems and govern with clear KPIs.
11. FAQs About the Firmographic Segmentation Framework (B2B)
Is firmographic segmentation still relevant with intent and AI models?
Yes. Intent and AI add timing and pattern recognition, but firmographics remain the foundation for where you have a right-to-win and how to organize coverage. The best programs combine firmographics with technographics and intent.
What’s the difference between firmographic segmentation and an ICP?
Firmographic segmentation defines broader groups (e.g., “US mid-market healthcare”). An ICP specifies the highest-probability subset (e.g., “US healthcare providers, 500–2,000 employees, multi-site, formal compliance program, modern cloud stack”). ICPs often add technographic and intent filters.
How many variables should we include?
Use as few as necessary to drive distinct decisions—typically 5–10 well-defined attributes (industry, size, geography, growth, ownership, regulatory exposure, procurement complexity). More variables increase noise and hinder execution.
What data sources should we use?
Start with CRM and first-party firmographics, then enrich with reputable external data for headcount, revenue, sub-industry, locations, and growth indicators. Validate with website/product clues and sales feedback. Refresh quarterly in dynamic markets.
How do we handle multi-division or global accounts?
Segment at the level you sell and support (global parent vs. region vs. business unit). Use roll-ups for executive reporting and distinct segment labels for operating units if needs and buying processes differ.
How long does it take to implement?
A pragmatic first cut takes 2–4 weeks (definitions, enrichment, validation). Full activation—coverage redesign, ABM audiences, scoring, and content—typically takes 6–12 weeks depending on scope.
Can startups and SMBs benefit?
Absolutely. Keep it lightweight: pick 2–3 priority segments with clear ICPs, enrich your top 500–2,000 target accounts, and align SDR/AE motions and messaging. The discipline prevents wasted spend and speeds early traction.
How often should we revisit segments?
Quarterly for data refresh; semi-annually for strategic review. Revisit sooner if your product roadmaps, compliance landscape, or demand patterns shift materially.
