

1. What Is the Demographic / Geographic / Psychographic / Behavioral Segmentation Schema?
The Demographic / Geographic / Psychographic / Behavioral Segmentation Schema is a foundational approach for dividing a market into meaningful, manageable groups so you can prioritize whom to serve and how to win. It classifies customers using four complementary “bases of segmentation”: who they are (Demographic), where they are (Geographic), what they believe and value (Psychographic), and what they do (Behavioral).
Within the broader Segmentation, Targeting, and Positioning (STP) toolkit, this schema provides a complete set of lenses to define distinct segments, size and value them, and tailor proposition, pricing, and go-to-market. Consultants and marketing leaders use it to move beyond one-size-fits-all plans, focusing scarce resources on the most attractive and addressable opportunities.
In plain terms: it helps you organize demand into groups that differ in needs, value, and response to marketing—so you can design offers and messages that resonate, choose channels that work, and allocate spend intelligently.
2. Origin and Background
Origin: Unknown; in use since at least the 1960s. The four “bases of segmentation” were popularized through marketing science and widely taught in business schools and classic marketing texts. Over decades, practitioners extended the schema to B2B (firmographic and technographic analogs) and to digital activation in CRM and ad platforms.
Why it was created: managers needed a rigorous, common language to partition heterogeneous markets into actionable slices. The schema brought structure and comparability, enabling better targeting decisions, clearer value propositions, and measurable performance improvements.
How it became widely known: through marketing curricula, seminal textbooks, and consulting practice. It remains a standard starting point before more specialized methods (e.g., needs-based or Jobs-to-be-Done segmentation) or advanced analytics (e.g., latent class models).
3. How the Schema Works
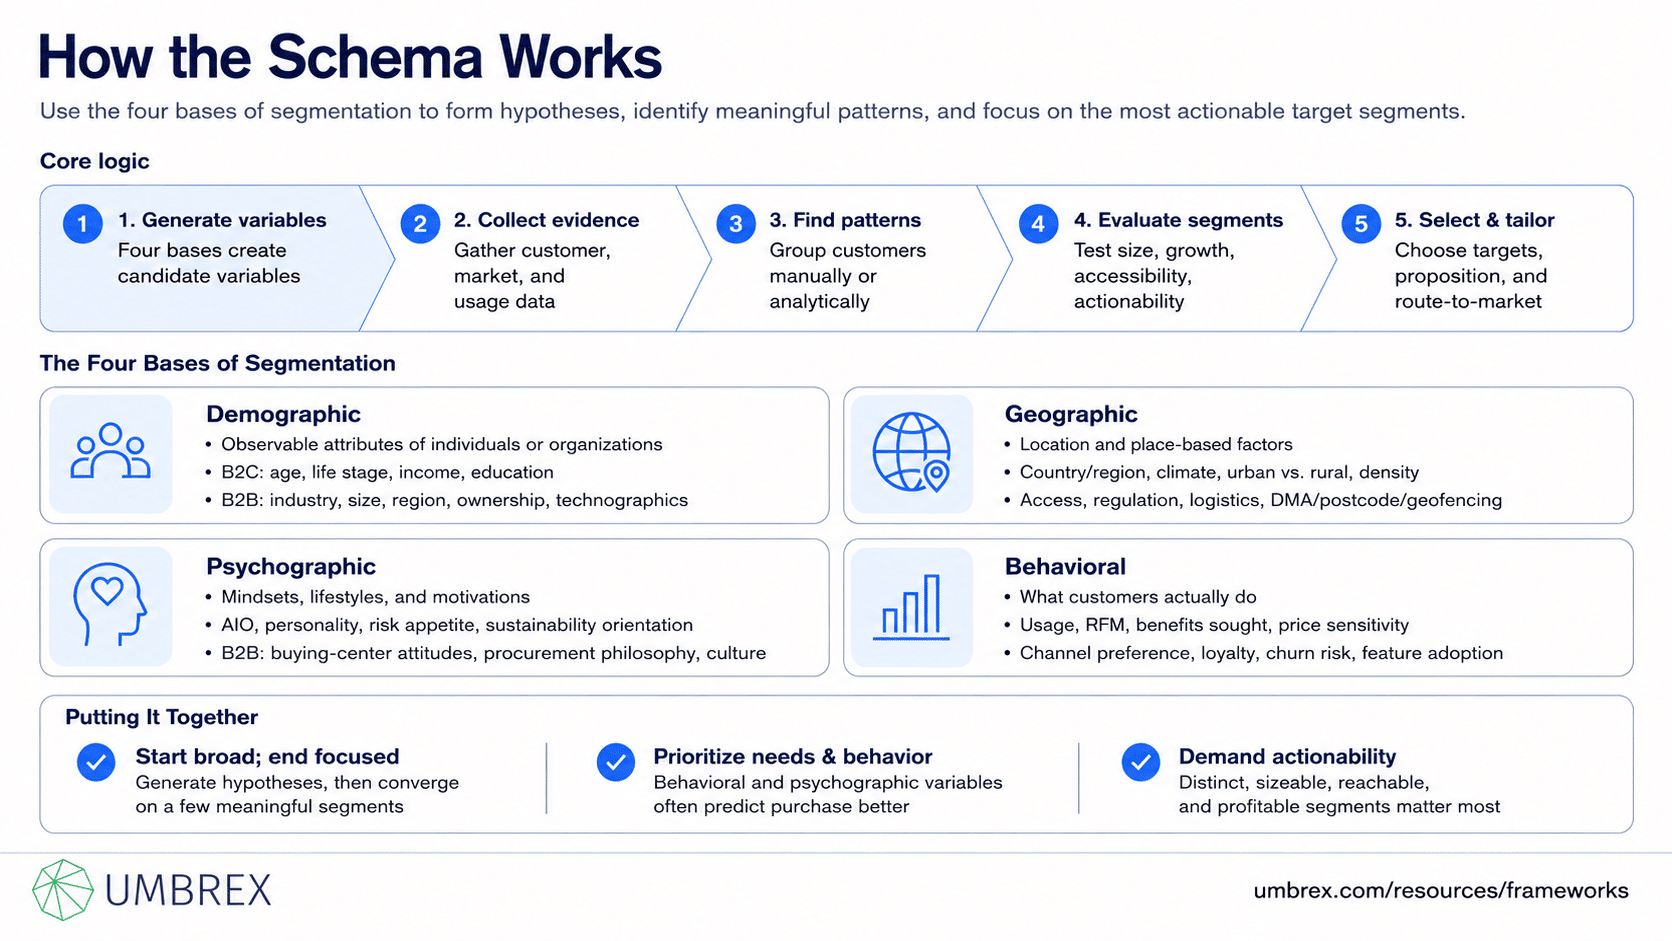
The schema is not a single algorithm—it’s a disciplined way to choose and combine variables that define meaningful segments. The core logic: start with a broad set of candidate variables across the four bases; collect evidence; find patterns (manually or analytically); evaluate segments against business criteria (size, growth, accessibility, actionability); then select targets and tailor the offer and route-to-market.
The Four Bases of Segmentation
- Demographic: Observable attributes of individuals (B2C) or organizations (B2B).
– B2C examples: age, life stage, gender, income, education, household size, occupation.
– B2B analogs (firmographics): industry, company size (employees/revenue), region, ownership, growth rate, structure; technographics (stack and adoption) are often paired here.
- Geographic: Location and place-based factors.
– Country/region, climate, urban vs. rural, population density, proximity to stores/hubs, regulatory regime, logistics access. In digital, “geo” can include DMA, postcode, or even geofenced behaviors.
- Psychographic: Mindsets and lifestyles—what customers value and why they buy.
– Attitudes, interests, opinions (AIO), lifestyle archetypes, personality traits, risk appetite, sustainability orientation, health consciousness, status seeking. For B2B, think buying-center attitudes (innovation vs. risk aversion), procurement philosophy, and governance culture.
- Behavioral: What customers actually do.
– Usage frequency, recency/frequency/monetary (RFM), benefits sought, price sensitivity, promotion response, channel preference, occasion of use, brand loyalty, churn risk, feature adoption, device habits.
Putting It Together
- Start broad; end focused: Use the four bases to generate hypotheses and collect data. Then converge on a small number of segments that differ meaningfully in needs and value.
- Prioritize behavioral and needs signals: Demographic and geographic variables are easy to observe but often weak predictors of purchase. Psychographic and behavioral variables more directly connect to why and how customers buy.
- Actionability matters: A great segment is distinct, sizeable, reachable (you can identify and target it), and profitable (you can serve it economically with a tailored proposition).
4. When to Use the Schema
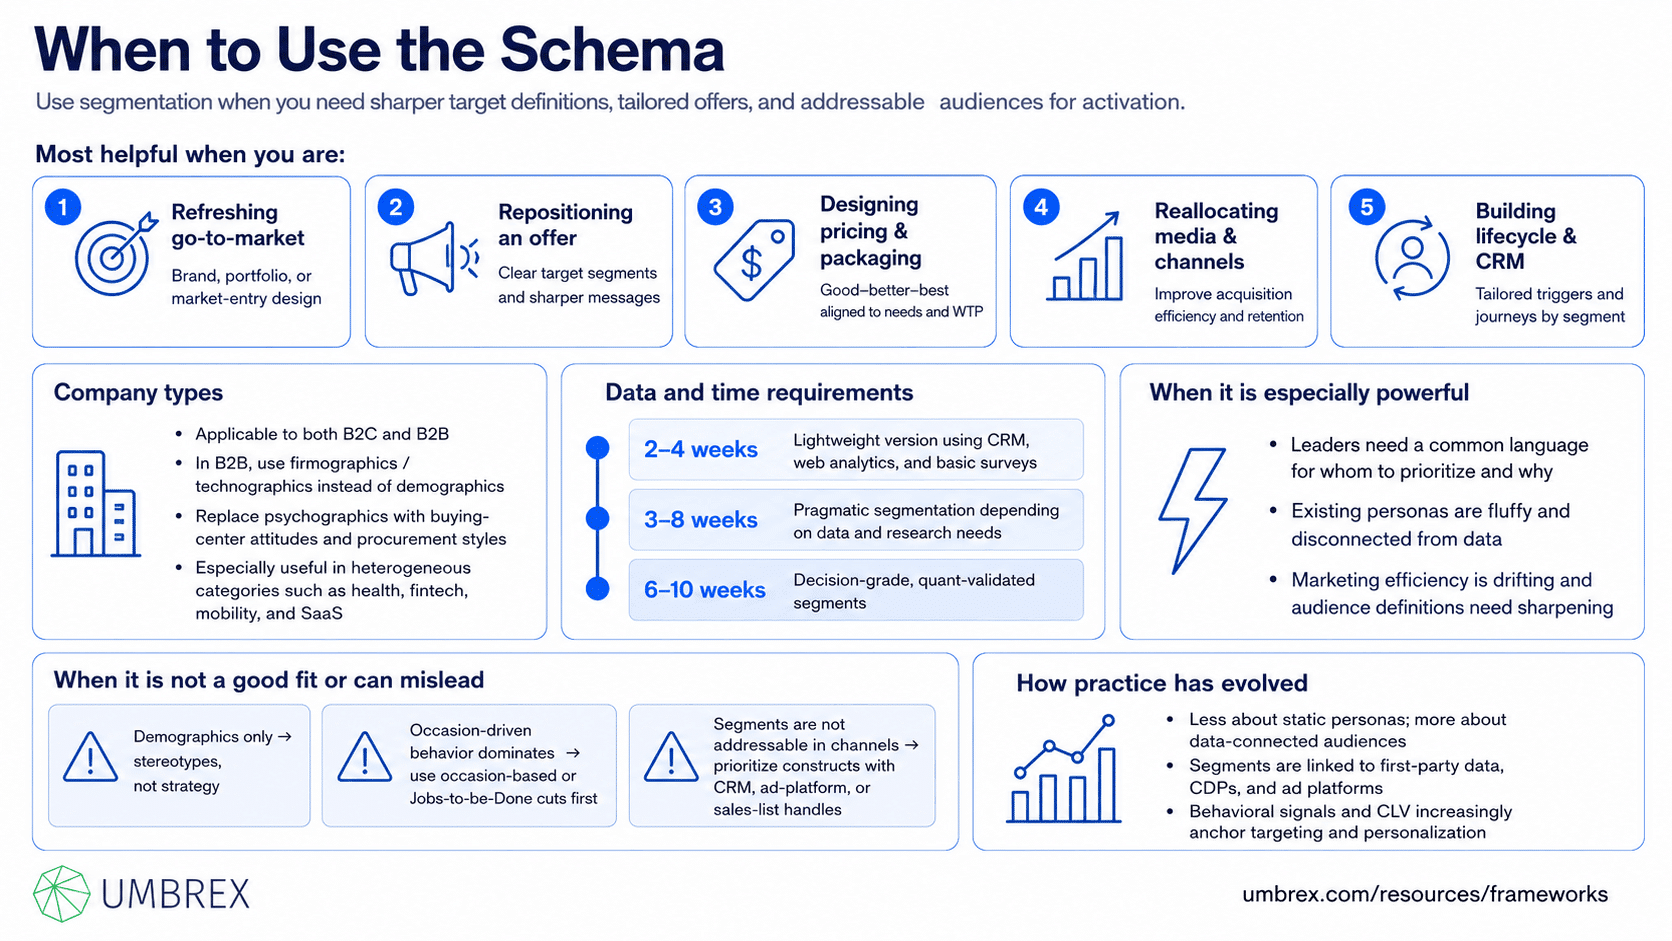
Most helpful when you are:
- Designing or refreshing your go-to-market for a brand, portfolio, or new market entry.
- Repositioning an offer and needing clear target segments and messages.
- Building a pricing and packaging architecture (good–better–best) aligned to distinct needs and willingness to pay.
- Reallocating media and channel mix to improve acquisition efficiency and retention.
- Designing lifecycle and CRM programs (triggers and journeys tailored by segment).
Company types: Applicable to B2C and B2B. In B2B, substitute demographics with firmographics/technographics and psychographics with buying-center attitudes and procurement styles. Especially powerful for categories with heterogeneous needs (health, fintech, mobility, SaaS) and multi-channel routes-to-market.
Data and time requirements: A pragmatic segmentation can be built in 3–8 weeks, depending on data availability and the need for primary research. Lightweight versions that rely on existing CRM, web analytics, and basic surveys can be done in 2–4 weeks; decision-grade, quant-validated segments often take 6–10 weeks.
When it is especially powerful: When leaders need a common language for whom to prioritize and why; when existing personas are fluffy and not connected to data; or when marketing efficiency is drifting and you need sharper audience definitions for digital activation.
When it is not a good fit or can mislead:
- If you rely only on demographics without linking to needs or behavior—you’ll get stereotypes, not strategy.
- When market dynamics are driven by context/occasion (e.g., mobility, food delivery) and the same person behaves differently by occasion—then occasion-based or Jobs-to-be-Done cuts should lead.
- If you cannot identify or reach the segments in your channels (no segment “handles” in CRM, ad platforms, or sales lists); prioritize addressable constructs.
How practice has evolved: Segmentation today is less about static personas and more about data-connected audiences. Teams link segments to first-party data, CDPs, and ad platforms; behavioral signals and value (CLV) increasingly anchor targeting and personalization.
5. How to Apply the Schema: Step-by-Step
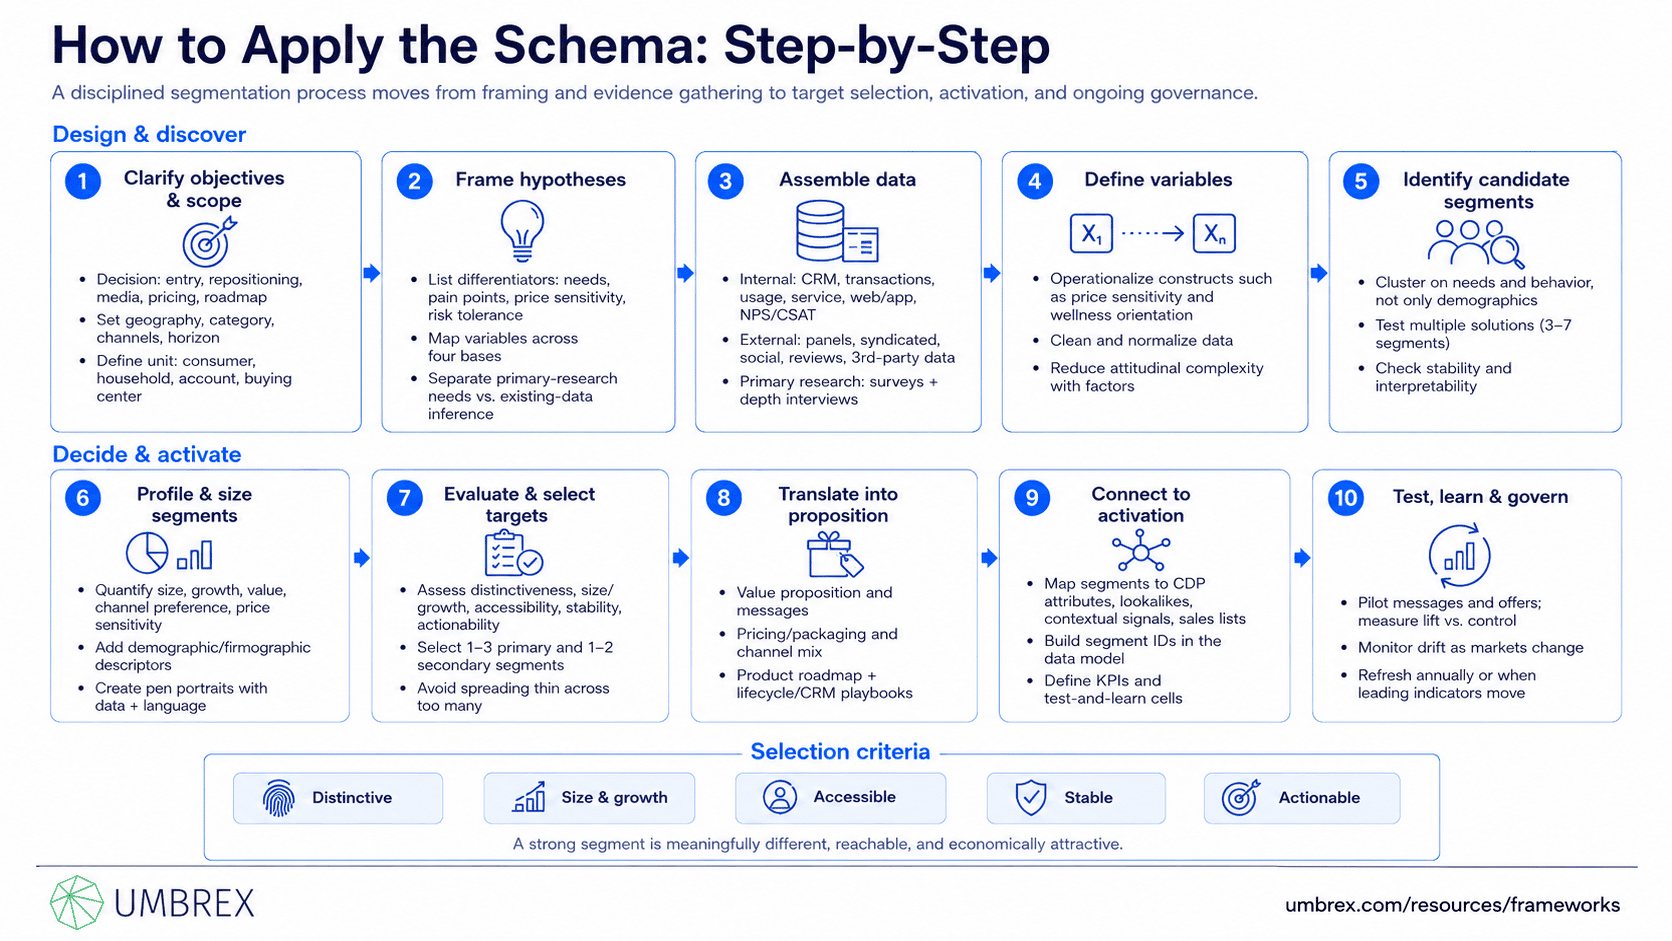
- Clarify objectives and scope
Define the decision you need to enable: market entry, repositioning, media allocation, pricing/packaging, product roadmap. Specify geography, category boundaries, channels, and time horizon. Identify the unit of analysis: individual consumer, household, account, or buying center.
- Frame hypotheses and information needs
List hypotheses about what truly differentiates buyers (benefits sought, pain points, price sensitivity, risk tolerance). Map these to variables across the four bases. Decide which require primary research vs. can be inferred from existing data.
- Assemble and collect data
Combine:
– Internal: CRM, transactions, usage telemetry, service tickets, web/app analytics, NPS/CSAT.
– External: Panels, syndicated data, social listening, ratings/reviews, third-party demographics/firmographics.
– Primary research: Structured surveys to capture benefits sought, attitudes, and trade-offs; depth interviews for context and language.
- Define variables and reduce complexity
Operationalize variables (e.g., “price sensitivity” via conjoint or stated scales; “wellness orientation” via psychometric items). Clean and normalize data. Use factor analysis or similar techniques to reduce correlated attitudinal items into a few interpretable factors.
- Identify candidate segments
Use clustering (e.g., k-means, hierarchical, latent class) on needs/behavior variables, not just demographics. Create multiple candidate solutions (e.g., 3–7 segments) and test for stability and interpretability. Avoid forcing patterns where none exist.
- Profile and size segments
For each segment, quantify size, growth, value (CLV/AOV), channel preferences, price sensitivity, and key pain points. Attach demographic/firmographic descriptors for practical identification. Build pen portraits that capture both data and human language.
- Evaluate and select target segments
Assess segments against criteria:
– Distinctiveness (differences matter for decisions)
– Size and growth (economic potential)
– Accessibility (can you find them in your channels?)
– Stability (won’t evaporate or morph each quarter)
– Actionability (you can design propositions and routes to serve them profitably)
Select 1–3 primary targets and 1–2 secondary segments; avoid spreading thin across many.
- Translate segments into positioning, pricing, and GTM
For each target segment:
– Value proposition and messages (benefits and proof points)
– Pricing/packaging (good–better–best, fences)
– Channel mix (paid/owned/earned; sales coverage)
– Product roadmap (features and experiences that matter)
– Lifecycle/CRM playbooks (onboarding, cross-sell, retention)
- Connect to activation
Map segment definitions to platform “handles”: attributes in your CDP, lookalike seeds, contextual signals, sales lists. Build segment IDs in your data model. Define measurement plans (KPIs by segment, test-and-learn cells). Ensure sales and service can recognize and act on segments.
- Test, learn, and govern
Pilot targeted propositions and messages; measure lift vs. control. Monitor drift (segments may shift as markets change). Refresh annually or when leading indicators move (behavior shifts, platform policies, macro factors).
6. Example: The Schema in Action
Context: A $500M direct-to-consumer (D2C) health and wellness brand selling supplements and functional beverages plans to accelerate growth in North America and enter two European markets within 12 months.
Problem: Acquisition efficiency is deteriorating, churn is rising in month 3, and the brand’s current personas are demographic-heavy and not connected to behavioral or CRM data. Leadership needs a segmentation to refocus positioning, pricing, and lifecycle marketing—and to guide international entry.
Approach: A 7-week segmentation program using the four bases, anchored in benefits sought and behavior.
- Data: 40 depth interviews; a quant survey (n=3,000) across US/Canada/UK/DE capturing attitudes (energy, focus, “clean label” orientation), benefits sought, price sensitivity (Gabor-Granger), and usage occasions; CRM and transaction logs (RFM, SKU mix, churn); web/app analytics; retailer reviews; third-party demographics.
- Variables: Needs (sustained energy vs. quick boost; cognitive focus vs. mood; clean label vs. performance-first), usage occasions (workday, workout, afternoon slump), price sensitivity, trial channel, subscription openness, and lifestyle orientations. Demographics and geographics used to profile and address segments, not to define them.
- Segmentation: Latent class model on needs/behavior yielded five interpretable segments:
– Clean Performance Optimizers (22%): prioritize efficacy and clean ingredients; high subscription openness; mid price sensitivity.
– Energy Pragmatists (28%): want reliable energy at fair price; low brand loyalty; promo responsive.
– Mindful Habit Builders (18%): routine-driven wellness; values sustainability and transparency; high retention potential.
– Occasional Treat Seekers (20%): flavor-first, infrequent use; impulse buyers; high churn risk.
– Gym‑to‑Desk Strivers (12%): performance and recovery; cross-sell into protein SKUs; respond to trainer/influencer proof.
Profiles and addressability: Segments differed by channel (creators vs. search vs. retail media), willingness to subscribe, and promo response. Demographic overlays (age, income) were broad; geographic overlays identified metro clusters for retail pilots. Behavioral handles (SKU mix, RFM, shop journey) allowed CRM activation; lookalike seeds were built from high-CLV segments.
Decisions and actions:
- Positioning: Led with “clean performance you can feel” for Clean Performance Optimizers and Mindful Habit Builders; separate creative stream for Energy Pragmatists emphasizing value and reliability.
- Pricing/packaging: Introduced a mid-tier subscription discount and value bundles for Pragmatists; launched a premium “clinical proof” line for Optimizers with third-party certifications.
- Channel mix: Increased creator partnerships and review-site presence for Strivers; shifted 15% budget from broad social to retail media in UK/DE to reach Pragmatists at point of consideration.
- Lifecycle/CRM: Personalized onboarding by segment; habit-building sequences for Mindful Habit Builders; churn-prevention offers for Treat Seekers; usage education content for Optimizers.
Outcome (six months): Blended CAC down 12%; month-3 churn down 6 points in targeted segments; subscription penetration up 9 points. UK entry focused on Pragmatists via retail media and value bundles; DE focused on Optimizers with premium proof-led messaging. The segmentation replaced vague personas with data-connected audiences that guided both creative and spend.
7. Strengths and Limitations
Strengths
- Comprehensive lenses: Ensures you consider who, where, why, and how—reducing blind spots.
- Action orientation: Links directly to positioning, pricing, channel, and lifecycle choices.
- Common language: Aligns cross-functional teams (marketing, product, sales, finance) on priority audiences.
- Flexible and scalable: Works for B2C and B2B; supports both quick wins with existing data and decision-grade research programs.
- Data-connected: Modern practice ties segments to first-party data and platforms, enabling activation and measurement.
Limitations
- Risk of superficiality: Demographic-only segments often fail to predict behavior or inform decisions.
- Psychographic pitfalls: Attitudinal segments can be unstable and hard to target if not linked to behavior and addressable attributes.
- Static snapshot: Segments drift as markets and platforms change; without refresh, plans go stale.
- Over-segmentation: Too many segments dilute resources and confuse execution.
- Activation gap: If segments can’t be recognized in your data and channels, they won’t translate to performance.
8. Common Pitfalls (and How to Avoid Them)
- Starting with demographics
What goes wrong: Stereotypes masquerade as strategy; poor prediction of purchase and response.
Avoid: Lead with needs and behavior. Use demographics to profile and reach, not to define segments.
- Persona theater
What goes wrong: Beautiful personas without data connections; no impact on spend or product.
Avoid: Build segment IDs in your CDP/CRM; define platform handles and measurement for activation.
- Too many segments
What goes wrong: Fragmented creative, complex operations, thin budgets.
Avoid: Pick 1–3 primaries and 1–2 secondaries; ensure resourcing before expanding.
- Ignoring addressability
What goes wrong: Segments can’t be identified in channels; plans stall.
Avoid: Validate that segments map to identifiable attributes or modelable audiences.
- Attitudinal instability
What goes wrong: Psychographic clusters drift; campaigns underperform.
Avoid: Anchor on stable needs/behaviors; track drift; refresh periodically.
- No link to economics
What goes wrong: Teams prioritize “interesting” segments, not valuable ones.
Avoid: Size and value segments (CLV, margin) and set guardrails (target CAC, payback).
- One-and-done
What goes wrong: Segmentation ages while platforms and demand shift.
Avoid: Embed in governance; refresh annually or when leading indicators move.
9. How the Schema Relates to Other Frameworks
- STP (Segmentation–Targeting–Positioning): The schema provides the segmentation lenses; Targeting chooses which segments to pursue; Positioning crafts propositions and messages for them.
- Jobs-to-be-Done (JTBD) and Needs-Based Segmentation: JTBD focuses on the underlying “job” and context. Use it to sharpen needs variables within this schema; particularly valuable when occasion/context drives behavior.
- RFM and Value Segmentation: Behavioral and economic cuts (recency, frequency, monetary value; CLV) complement psychographic/needs segmentation for lifecycle and CRM decisions.
- Conjoint/Max-Diff and WTP tools: Quantify attribute importance and price sensitivity within segments; essential for pricing and packaging design.
- Competitive Positioning Map: After choosing target segments, use price–benefit maps to position relative to competitors for those segments.
- Strategic Canvas / Value Curve: Use canvas to design differentiated value propositions that align with priority segments’ needs.
- Customer Journey Mapping: Map segment-specific journeys to identify friction and design targeted interventions.
- ICP (Ideal Customer Profile) for B2B: The B2B articulation of target segments, blending firmographics/technographics with buying-center behaviors.
Choosing approaches: Start with the four-base schema to ensure comprehensive coverage; deepen with JTBD when context matters, and with value/CLV cuts for economics. Use conjoint to translate segment needs into product and pricing decisions.
10. Key Takeaways
- The Demographic/Geographic/Psychographic/Behavioral schema is a comprehensive, practical way to segment markets and focus resources.
- Lead with needs and behavior; use demographics and geography to profile and reach, not to define.
- Great segments are distinct, sizeable, reachable, stable, and actionable—and tied to economics.
- Connect segments to data and channels (CDP, CRM, ad platforms) to enable activation and measurement.
- Refresh regularly; pair with JTBD, value segmentation, and pricing research to move from insight to impact.
11. FAQs About the Schema
Is this segmentation approach still relevant today?
Yes. The four bases remain the most practical way to ensure coverage of who, where, why, and how. What’s changed is execution: segments must be data-connected and activation-ready, with behavioral and value signals front and center.
What’s the difference between psychographic and behavioral segmentation?
Psychographic captures mindsets—attitudes, values, and lifestyle; behavioral captures observed actions—usage, channel choice, price sensitivity, loyalty. Psychographic can explain why; behavioral shows what. Effective segmentation links the two for actionability.
How does this apply in B2B?
Swap in firmographics (industry, size, growth), geographies, buying-center psychographics (risk appetite, procurement style), and behaviors (usage, renewal patterns, expansion propensity). Define an Ideal Customer Profile (ICP) for targeting and sales coverage.
How many segments should we create?
As few as necessary to drive distinct choices—typically 3–6. More segments increase complexity and dilute resources. Start with primaries and add nuance in activation tiers or sub-segments as needed.
How much data do we need?
Enough to define stable, interpretable patterns and to connect segments to activation. Many teams start with existing CRM/analytics plus a targeted survey (n=1,000–3,000 for B2C; n=300–800 for B2B decision-makers) and iterate.
Should we use AI/ML for segmentation?
Use ML to scale and score segments, predict propensity, and update assignments in real time—especially for behavioral and value cuts. But start with clear business questions and interpretable segments; black boxes without clear handles hinder activation.
How often should we refresh segments?
Annually for most businesses; more frequently in fast-moving categories or when leading indicators shift (usage patterns, platform policies, macro changes). Keep a light-touch monitoring cadence.
