

1. What Is the Route‑to‑Market Design Framework?
The Route‑to‑Market (RTM) Design Framework is a structured approach to decide how your company reaches, sells to, and serves customers across channels and geographies—at the right cost and level of control. It integrates choices about channels (direct, indirect, digital), coverage models (field, inside, partners), distribution and logistics, partner programs, pricing and trade terms, and service levels. The goal is simple: maximize availability, conversion, and customer experience while minimizing cost‑to‑serve and channel conflict.
In Marketing—specifically within market, portfolio & environmental analysis—RTM design connects strategy to execution. It translates target segments and value propositions into concrete choices about who sells, through which channels, with what offers, at what price, supported by what service, and enabled by what systems. It’s a staple in consulting because it makes a complex web of commercial and operational decisions visible, testable, and economically grounded.
Operationally, RTM is both a strategy and an operating model framework. It clarifies the trade‑offs between reach and control, cost and service, speed and depth of engagement. Executives use it to enter new markets, scale efficiently, fix profitability leaks, improve availability and service levels, and align internal and partner incentives.
2. Origin and Background
Origin: Unknown; in use since at least the 1990s. The vocabulary and methods emerged as consumer goods, telecom, and industrial firms professionalized distribution and sales coverage—especially in fragmented retail and emerging markets—and as consulting firms codified repeatable RTM approaches.
Why it was created: Companies needed a disciplined way to choose and manage channels, distributors, and sales coverage as markets became more complex. Ad hoc decisions led to gaps in coverage, high cost‑to‑serve, inconsistent customer experience, and channel conflict. RTM frameworks provided a way to align segment needs, economics, and capabilities into a coherent go‑to‑market design.
How it became widely known: Through business school teaching on channels and distribution, and through widespread adoption in CPG, pharma, and industrials—later expanded to digital and omnichannel contexts (marketplaces, DTC, inside sales, self‑serve).
3. How the Route‑to‑Market Design Framework Works
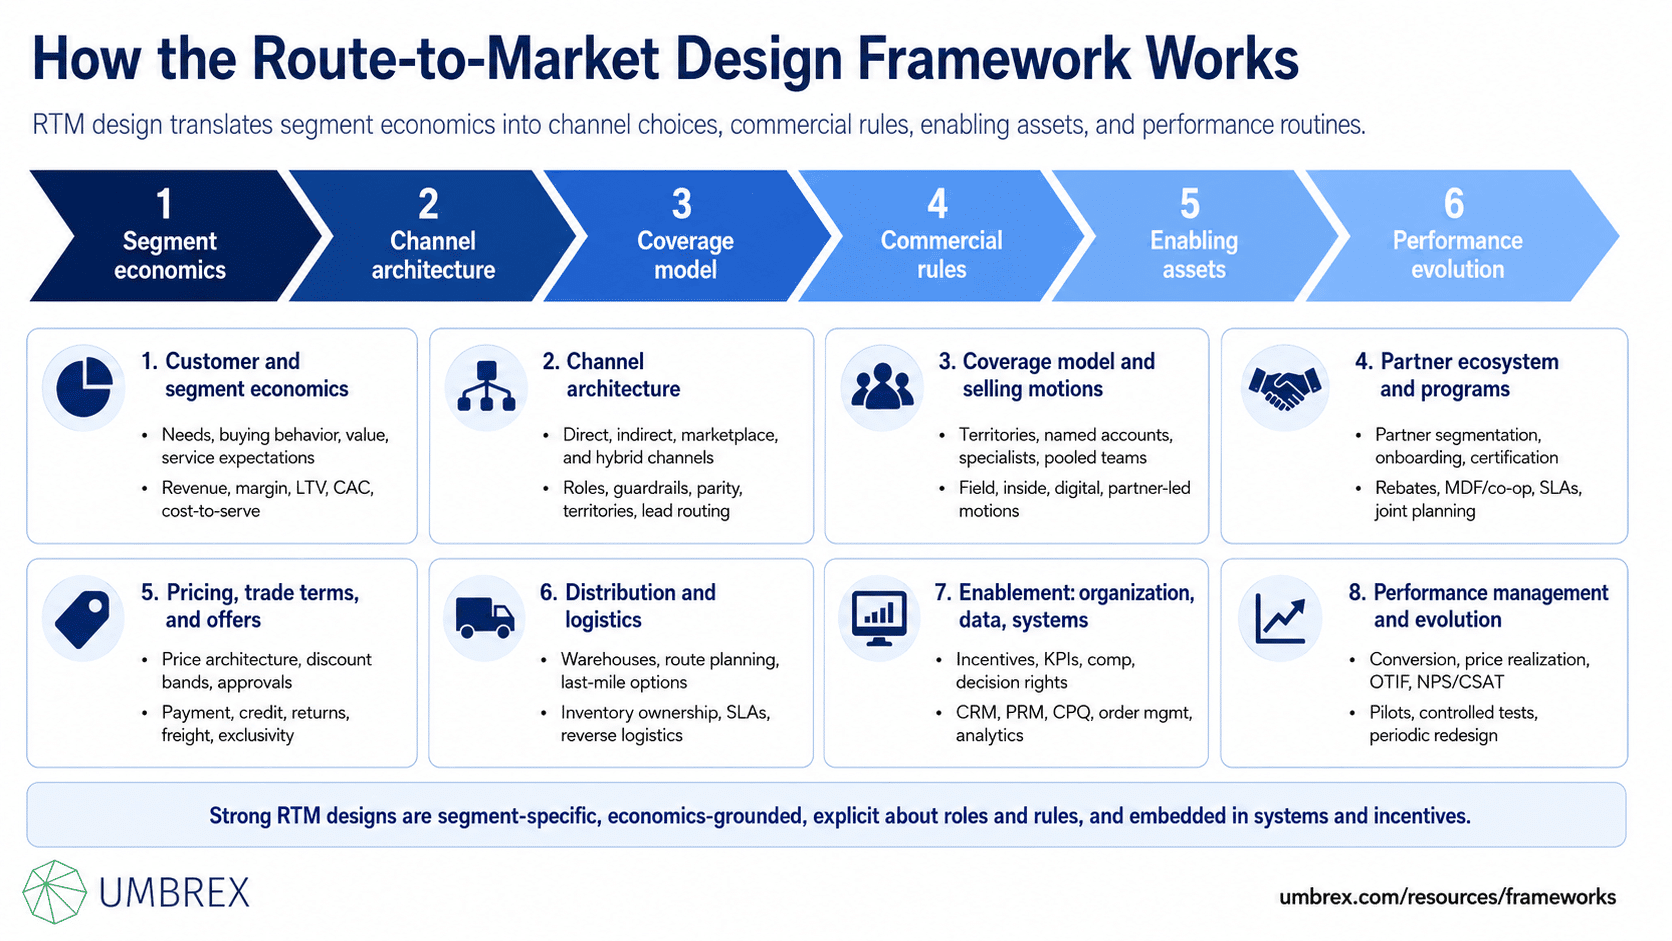
The core logic follows a simple sequence: understand customer segments and economics; choose a channel architecture and coverage model; define the commercial “rules of the road” (pricing, trade terms, incentives, service levels); build the enabling assets (organization, partners, systems, logistics); and manage performance and evolution over time.
Key components:
- Customer and segment economics
- Define segments by needs, buying behavior, potential value, and service expectations (e.g., self‑serve vs. high‑touch).
- Quantify economics: revenue potential, margin, cost‑to‑serve, lifetime value (LTV), acquisition cost (CAC), and propensity to buy via each channel.
- Channel architecture
- Decide which channels participate: direct (field, inside, ecommerce/DTC), indirect (distributors, wholesalers, VARs, agents, retailers, marketplaces), and hybrids.
- Assign roles: primary sales vs. fulfillment, hunting vs. farming, lead generation vs. conversion vs. service.
- Define guardrails to minimize conflict: segment or product exclusivity, price parity rules, lead routing, and territory boundaries.
- Coverage model and selling motions
- Choose how you cover accounts: territories, named accounts, vertical specialists, or pooled teams.
- Define motions: enterprise field sales, inside sales, telesales, self‑serve digital, partner‑led, outbound/inbound marketing.
- Design capacity: headcount, call patterns, visit frequency, and service tiers by segment.
- Partner ecosystem and programs
- Segment partners (distributors/VARs/retailers) by capability and reach; define selection criteria.
- Create partner programs: onboarding, certification, MDF/co‑op funds, rebates, SLAs, data sharing, and joint planning.
- Set partner economics: margin structures, volume rebates, performance bonuses tied to KPIs.
- Pricing, trade terms, and offers
- Establish price architecture by channel/segment; define discount bands and approvals.
- Set trade terms: payment, credit, returns, freight, marketing support, and exclusivity.
- Design packaging/bundles and service levels tailored to each channel’s role.
- Distribution and logistics
- Determine network footprint: warehouses, cross‑docks, route planning, last‑mile options.
- Assign inventory ownership and service levels by channel; define fulfillment promises (SLA, cut‑off times).
- Integrate reverse logistics and after‑sales service where relevant.
- Enablement: organization, data, and systems
- Align org structure, incentives, and KPIs with the RTM design; avoid misaligned comp that fuels conflict.
- Deploy enabling systems: CRM, PRM (partner relationship management), CPQ, order management, pricing, and analytics.
- Codify processes: lead management, deal desk, joint business planning (JBP), and performance reviews.
- Performance management and evolution
- Track coverage, conversion, price realization, mix, availability/OTIF, cost‑to‑serve, partner performance, and NPS/CSAT.
- Use pilots and controlled tests to refine; plan periodic redesign as markets, channels, or regulations change.
Well‑crafted RTM designs are segment‑specific, economics‑grounded, and explicit about roles and rules. They minimize gray zones that create channel conflict, and they embed the design in systems and incentives so it holds up under pressure.
4. When to Use the Route‑to‑Market Design Framework
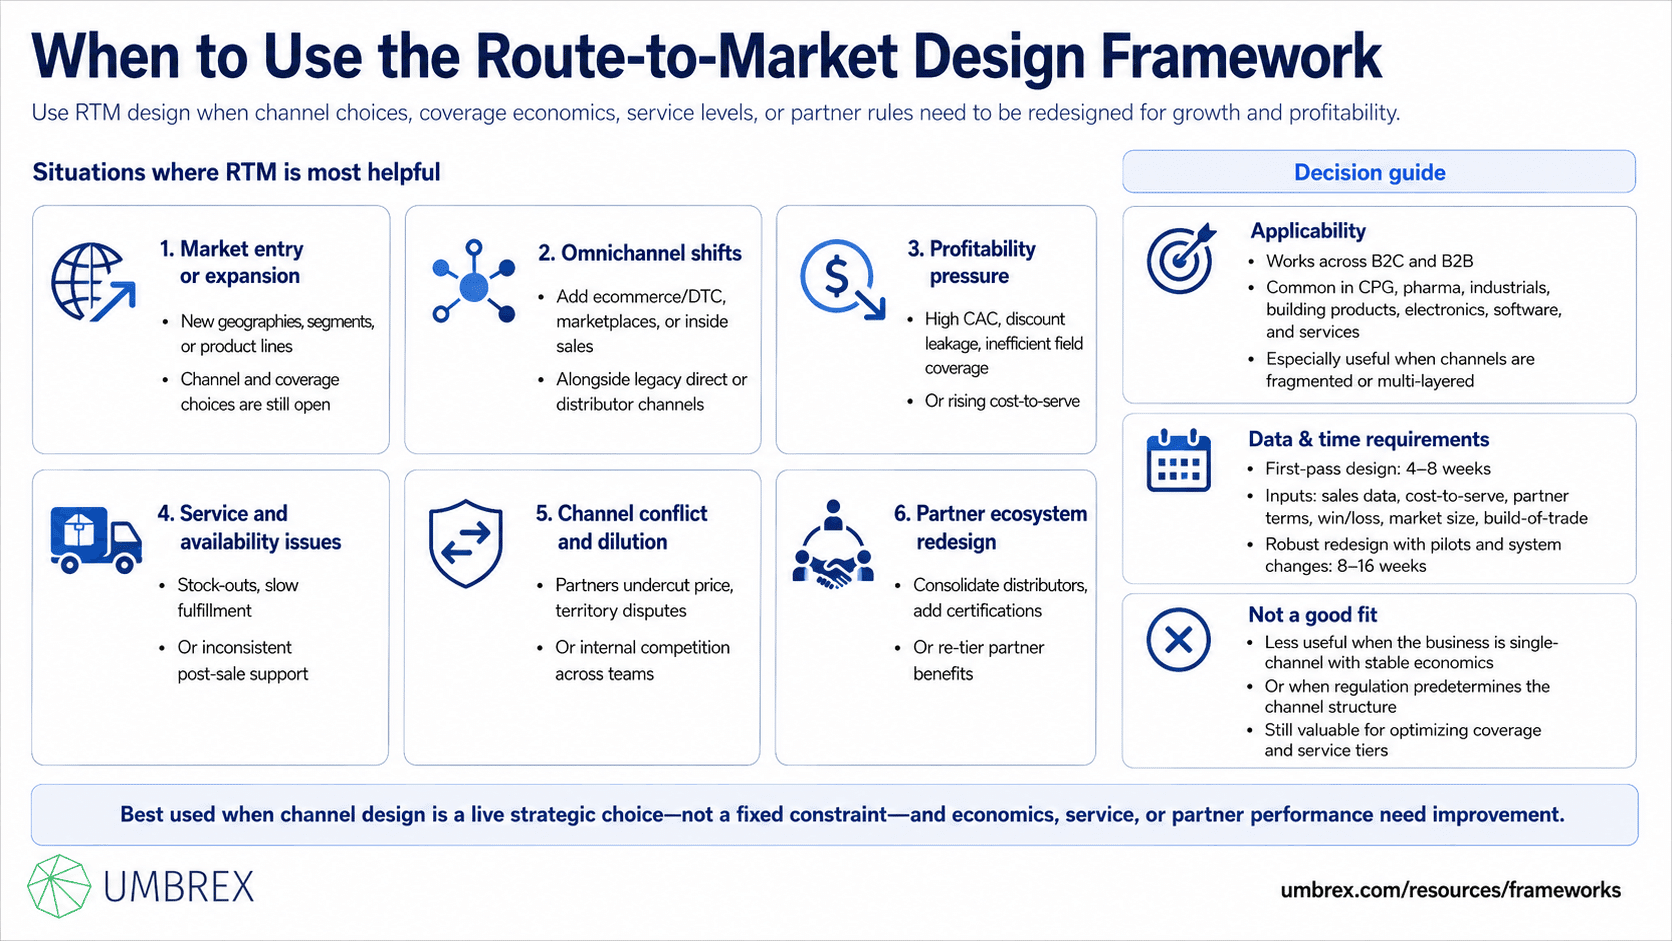
Situations where RTM is most helpful:
- Market entry or expansion: New geographies, customer segments, or product lines where coverage and channel choices are open questions.
- Omnichannel shifts: Adding ecommerce/DTC, marketplaces, or inside sales alongside legacy direct or distributor channels.
- Profitability pressure: High CAC, discount leakage, inefficient field coverage, or rising cost‑to‑serve.
- Service and availability issues: Stock‑outs, slow fulfillment, or inconsistent post‑sale support.
- Channel conflict and dilution: Partners undercutting price, territory disputes, or internal competition across teams.
- Partner ecosystem redesign: Consolidating distributors, introducing certifications, or re‑tiering partner benefits.
Company types: Applicable across B2C and B2B—CPG, pharma, industrials, building products, electronics, software, and services. Especially powerful where channels are fragmented or multi‑layered.
Data and time requirements: A solid first pass takes 4–8 weeks using internal sales data, cost‑to‑serve analysis, partner terms, win/loss, and market size/build‑of‑trade. More robust designs (with pilots and system changes) typically run 8–16 weeks.
Not a good fit when: The business is single‑channel with stable economics, or regulatory constraints predetermine channels (e.g., mandated distribution). Even then, RTM can optimize coverage and service tiers but won’t change the fundamental channel structure.
5. How to Apply the Route‑to‑Market Design Framework: Step‑by‑Step
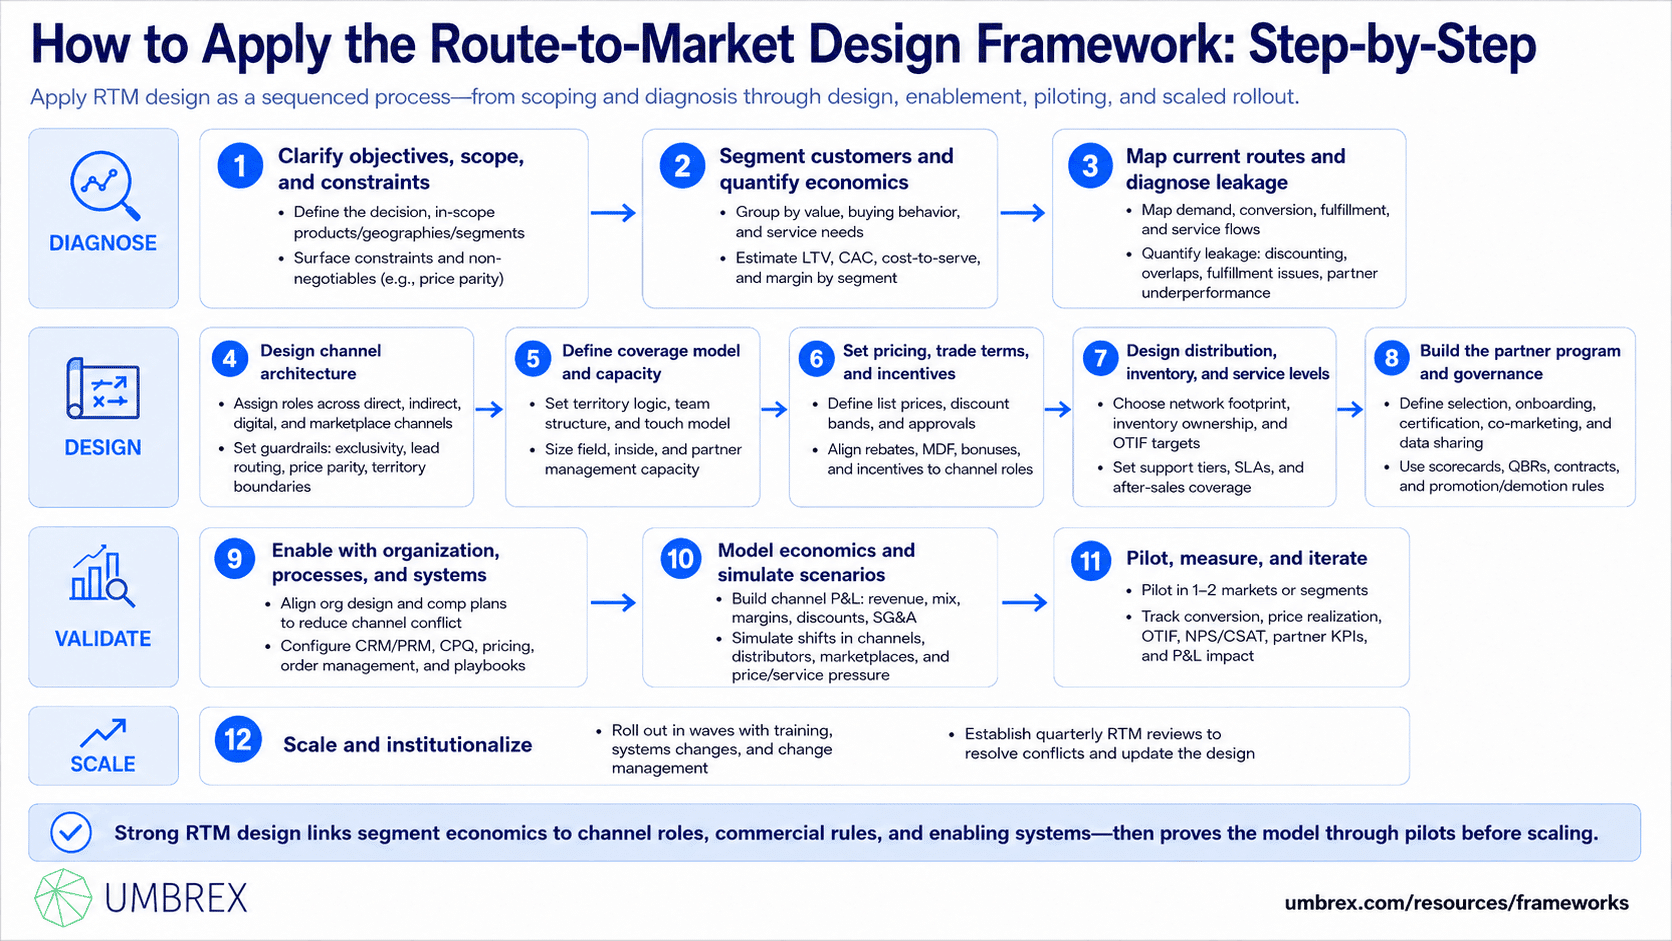
- Clarify objectives, scope, and constraints.
Specify the decision: new market entry, omnichannel expansion, distributor re‑tiering, or sales coverage redesign. Define in‑scope products, geographies, and segments. Surface constraints (regulatory, channel commitments, credit terms, minimum service levels) and non‑negotiables (e.g., maintaining price parity).
- Segment customers and quantify economics.
Group customers by potential (current and future value), buying behavior (self‑serve vs. assisted; digital vs. face‑to‑face), and service needs (speed, customization, technical support). Estimate LTV, CAC by motion, cost‑to‑serve, and margin by segment to determine which channels can serve each segment economically.
- Map the current routes and diagnose leakage.
Document current channels, partners, coverage, and flows: who generates demand, who converts, who fulfills, and who services. Quantify leakage points: discounting outside guardrails, long tail accounts with high cost‑to‑serve, slow fulfillment, territory overlaps, or partner underperformance. Build a baseline P&L and margin waterfall by channel.
- Design the channel architecture.
Choose which channels participate and their roles by segment/product. Examples:
- Direct enterprise field for strategic accounts; inside sales for mid‑market; ecommerce/self‑serve for SMB/long tail.
- Tier‑1 distributors for broad reach and inventory; specialized VARs for integration; marketplaces for breadth and demand capture.
Define conflict‑minimizing rules: exclusivity by segment or SKU, lead routing, price parity, and territory boundaries.
- Define coverage model and capacity.
Set territory design (geographic, vertical, or named accounts), team structures (hunters vs. farmers; pre‑/post‑sales), and activity models (visit frequency, digital touch cadences). Model required headcount by segment and route (field, inside, partner managers) and validate with productivity benchmarks.
- Set pricing architecture, trade terms, and incentives.
Establish list prices and discount bands by channel/segment with approval workflows (deal desk). Define trade terms (payment, freight, returns, co‑op/MDF) and partner incentive mechanics (rebates, tier thresholds, growth bonuses, certification benefits). Ensure incentives reinforce the intended roles (e.g., services attach for VARs, availability KPIs for distributors).
- Design distribution, inventory, and service levels.
Choose the network footprint (warehouses/3PLs), inventory ownership, and service promises by segment (OTIF targets, cut‑off times). Set after‑sales support tiers (SLA, spare parts, on‑site coverage). Align logistics design with channel roles to hit availability at optimal cost.
- Build the partner program and governance.
Define partner selection criteria, onboarding, enablement, certification, co‑marketing, data sharing, and quarterly business reviews. Create a partner scorecard and a clear path for promotion/demotion. Draft template contracts with performance clauses and territory definitions.
- Enable with organization, processes, and systems.
Align org structure and comp plans to avoid channel conflict (e.g., credit for partner‑assisted deals). Configure CRM/PRM, CPQ, pricing, and order management systems to enforce rules (lead routing, discount approvals, price parity). Publish playbooks: lead handling, deal registration, escalation, and exception management.
- Model the economics and simulate scenarios.
Build a financial model: revenue, price realization, mix, rebates/discounts, cost‑to‑serve, partner margins, and SG&A by channel. Simulate scenarios (e.g., shift 20% of SMB to inside sales; add two marketplaces; consolidate distributors by 30%) and stress‑test sensitivities (price pressure, service level changes).
- Pilot, measure, and iterate.
Run controlled pilots in 1–2 markets or segments. Measure conversion, price realization, cycle time, OTIF, NPS/CSAT, partner performance, and P&L impact. Collect qualitative feedback (customer, sales, partners) and refine roles, rules, and incentives before scaling.
- Scale and institutionalize.
Roll out in waves, with training, systems configuration, and change management. Establish a quarterly RTM review to monitor KPIs, resolve conflicts, and update design choices as markets and channels evolve.
6. Example: RTM Design in Action
Company: An $800M industrial safety equipment manufacturer expanding in Latin America while facing margin pressure in mature markets.
Problem: Coverage was patchy: large accounts expected technical presales and rapid service, while the long tail bought opportunistically from distributors with inconsistent availability and heavy discounting. The company added a web store, which angered distributors who perceived undercutting. CAC was rising; price realization was slipping.
Applying the framework:
- Segmentation and economics: Split customers into Strategic (enterprise/industrial plants), Growth Mid‑Market (regional contractors), and Long Tail (small workshops). Modeled LTV/CAC and cost‑to‑serve; found field coverage was overused for low‑value accounts.
- Channel architecture: Assigned enterprise accounts to direct field sales with dedicated technical presales and service SLAs. Designated tier‑1 distributors for mid‑market and a certified VAR tier for integration projects. The web store became a fulfillment channel for the long tail with price parity to distributors and a lead‑sharing program.
- Coverage and capacity: Created vertical specialist teams for oil & gas and mining; moved 40% of SMB outreach to inside sales. Implemented deal registration and lead routing to partners with clear response SLAs.
- Pricing and terms: Introduced discount bands and a deal desk; standardized distributor rebates with growth and mix bonuses; added MDF tied to demand generation and service attach rates. Enforced price parity between web and distributor channels for overlapping SKUs.
- Distribution and service: Added a regional DC with cross‑dock capability; defined OTIF targets by segment (95% for strategic, 90% for mid‑market, 85% for long tail) and spare parts SLAs for enterprise accounts.
- Enablement: Deployed PRM for partner onboarding, certifications, and QBRs; aligned sales comp to grant credit on registered partner‑assisted deals to reduce internal conflict.
Results (12 months): Price realization improved 180 bps; enterprise win rates rose by 9 points; SMB CAC fell 22% via inside sales and self‑serve; OTIF improved to 94% in strategic accounts; distributor satisfaction rebounded as web leads converted to partner‑fulfilled orders in designated territories. The P&L model showed a 250 bps improvement in contribution margin in the region.
7. Strengths and Limitations
Strengths
- Sharpens trade‑offs: Forces explicit choices between reach vs. control, cost vs. service, and direct vs. indirect.
- Economics‑driven: Grounds coverage and channel choices in LTV/CAC, price realization, and cost‑to‑serve, not anecdotes.
- Reduces channel conflict: Clear roles, rules, and incentives minimize friction and margin leakage.
- Scalable and repeatable: Provides a blueprint for entering new markets and evolving to omnichannel models.
- Cross‑functional alignment: Unites marketing, sales, supply chain, finance, and partners around one design.
Limitations
- Complexity: Many moving parts—channels, partners, systems—require disciplined governance; half‑measures can backfire.
- Data limitations: LTV/CAC and cost‑to‑serve data can be noisy; decisions risk false precision if not triangulated.
- Execution dependence: The best design fails without system enforcement (CRM/PRM, pricing) and aligned incentives.
- Static risk: Markets and channels evolve quickly; designs that aren’t refreshed become obsolete.
- Regulatory and contractual constraints: In some sectors, channel rules limit feasible options.
8. Common Pitfalls (and How to Avoid Them)
- Copy‑pasting a model from another market.
What goes wrong: Misfit with local channel norms and economics; partner backlash.
How to avoid: Start with local segment and channel economics; pilot and adapt before scaling.
- Treating RTM as a sales org chart exercise.
What goes wrong: Ignores channel rules, pricing, logistics, and partner economics—conflict and leakage persist.
How to avoid: Address the full stack: channels, coverage, pricing/terms, logistics, systems, and incentives.
- Underestimating partner economics and capabilities.
What goes wrong: Unrealistic expectations; poor execution; channel churn.
How to avoid: Build partner P&Ls; tier and certify; fund enablement; tie rebates to behaviors you need.
- Unclear rules of engagement.
What goes wrong: Territory disputes, double compensation, price undercutting.
How to avoid: Document exclusivity, lead routing, price parity, and crediting rules; enforce via systems.
- Over‑servicing low‑value segments.
What goes wrong: High cost‑to‑serve; negative unit economics.
How to avoid: Shift to inside sales or self‑serve; set service tiers; reserve field resources for high‑value segments.
- Ignoring digital channels and marketplaces.
What goes wrong: Missed demand, inconsistent pricing, partner resentment of DTC moves.
How to avoid: Integrate ecommerce roles with partner programs; set clear price and fulfillment rules.
- Weak change management.
What goes wrong: Shadow practices revert; partners ignore rules; systems aren’t configured.
How to avoid: Train, communicate, align incentives, and configure systems before launch; audit and course‑correct.
- No piloting or measurement.
What goes wrong: Large‑scale rollout embeds design flaws; hard to unwind.
How to avoid: Pilot in 1–2 markets; use clear KPIs and feedback loops; iterate before scaling.
9. How RTM Relates to Other Frameworks
- Segmentation–Targeting–Positioning (STP): STP defines who you serve and your value proposition. RTM operationalizes how you reach and serve those segments across channels with the right economics.
- Porter’s Five Forces: Five Forces highlights channel power and industry structure. RTM then designs channel choices and partner programs to navigate or reshape those forces.
- Value Chain and Profit Pool Analysis: Use these to see where value accrues along the chain; RTM allocates roles, margins, and capabilities accordingly.
- Pricing Architecture and Discount Governance: These ensure price realization within RTM rules (deal desk, bands, parity) and reduce leakage.
- Sales Coverage Models and Territory Design: Complement RTM by detailing headcount, territories, and call patterns within the chosen architecture.
- Operating Model and 7‑S/Target Operating Model: Align structure, processes, systems, and incentives to the RTM so the design is executable.
- Category Role/Category Management (for retail/CPG): Category roles set investment posture; RTM determines how those choices are executed across channels and partners to hit availability and price image.
- Customer Lifetime Value (LTV) and CAC Analytics: Provide the economic lens to determine which channels and service levels are sustainable by segment.
Choosing among tools: If the question is “Where should we play and what is our proposition?” start with STP and competitive analysis. If the question is “How do we physically and digitally reach and serve those customers at scale?” use RTM. Layer pricing governance and territory design to implement the RTM choices.
10. Key Takeaways
- Route‑to‑Market design determines how you reach, sell to, and serve customers across channels with clear roles, rules, and economics.
- Anchor RTM in segment needs and unit economics (LTV/CAC, price realization, cost‑to‑serve), not org charts or legacy channels.
- Explicit rules of engagement, pricing and trade terms, and partner programs are essential to reduce conflict and leakage.
- Enable the design with organization, incentives, systems (CRM/PRM/pricing), and logistics that match service promises.
- Pilot and iterate; markets and channels evolve quickly—refresh RTM at least annually or after major shifts.
11. FAQs About the Route‑to‑Market Design Framework
Is RTM the same as Go‑to‑Market (GTM)?
They overlap but are not identical. GTM defines how you create demand and position the offer (segments, messaging, launch plans). RTM focuses on the pathways and mechanisms to reach, convert, fulfill, and serve customers (channels, partners, coverage, logistics, pricing/terms). Use GTM to set the commercial strategy; use RTM to make it executable at scale.
How often should we redesign our RTM?
Review quarterly via KPIs and friction logs; refresh design annually. Trigger a redesign after major events: adding new channels (marketplaces, DTC), entering new geographies, regulatory change, or persistent channel conflict or economics drift.
Can small or early‑stage companies use RTM?
Yes. Start simple: one or two channels (e.g., self‑serve plus inside sales), clear rules, and lightweight systems. As you scale, add partners and structure incentives and governance. The discipline matters more than the complexity.
How long does a robust RTM project take?
A focused redesign for a region or segment typically takes 8–12 weeks, including diagnostics, design, partner outreach, and pilots. Enterprise‑wide transformations with system changes can take 3–6 months or more, depending on complexity.
What data do we need to do this well?
Sales and margin by customer/segment, price realization and discounting, CAC by motion, cost‑to‑serve, win/loss, partner performance, inventory/OTIF, and market size/coverage. Triangulate with customer and partner interviews to fill data gaps.
How do we prevent channel conflict?
Define explicit roles and rules (exclusivities, price parity, lead routing), align incentives (crediting and rebates), enforce via systems (CRM/PRM, deal registration, discount approvals), and run regular governance (QBRs, conflict resolution paths). Pilot changes and communicate early with partners.
