

1. What Is the Market Entry Mode Matrix?
The Market Entry Mode Matrix is a decision framework for selecting how to enter a new country or market—comparing options such as exporting, licensing, franchising, distributor arrangements, joint ventures, greenfield subsidiaries, and acquisitions. It visualizes (and scores) entry modes along key dimensions—typically control vs. resource commitment (or risk), and sometimes speed or flexibility—so executives can weigh trade-offs explicitly.
In plain language: it helps you choose “how to go” as well as “where to go.” Different modes offer different levels of control over the brand and operations, require different investments, move at different speeds, and expose you to different risks. The matrix brings these differences onto one page to support a disciplined, evidence-based entry decision.
This is a foundational market and portfolio analysis tool. Consultants and executives use it to compare entry modes, align cross-functional stakeholders (strategy, legal, tax, supply chain, commercial), and plan phased pathways (e.g., from partner-led entry to a wholly owned subsidiary as scale and capability grow).
2. Origin and Background
Origin: Unknown; in use in international business practice and teaching since at least the 1980s–1990s.
The framework emerged to solve a common problem in international expansion: teams leapt to familiar modes (e.g., “find a distributor,” “buy a local player”) without systematically weighing control, investment, speed, risk, and learning needs. By plotting entry modes across a few critical dimensions—and scoring them against decision criteria—leaders could make trade-offs explicit and plan migrations as conditions evolved.
It became widely known through business school curricula, international business texts, and consulting work. Variations abound (2×2 matrices, weighted scoring models, hybrid pathways), but the core logic is consistent: match the entry mode to strategic objectives, constraints, and market realities.
3. How the Market Entry Mode Matrix Works
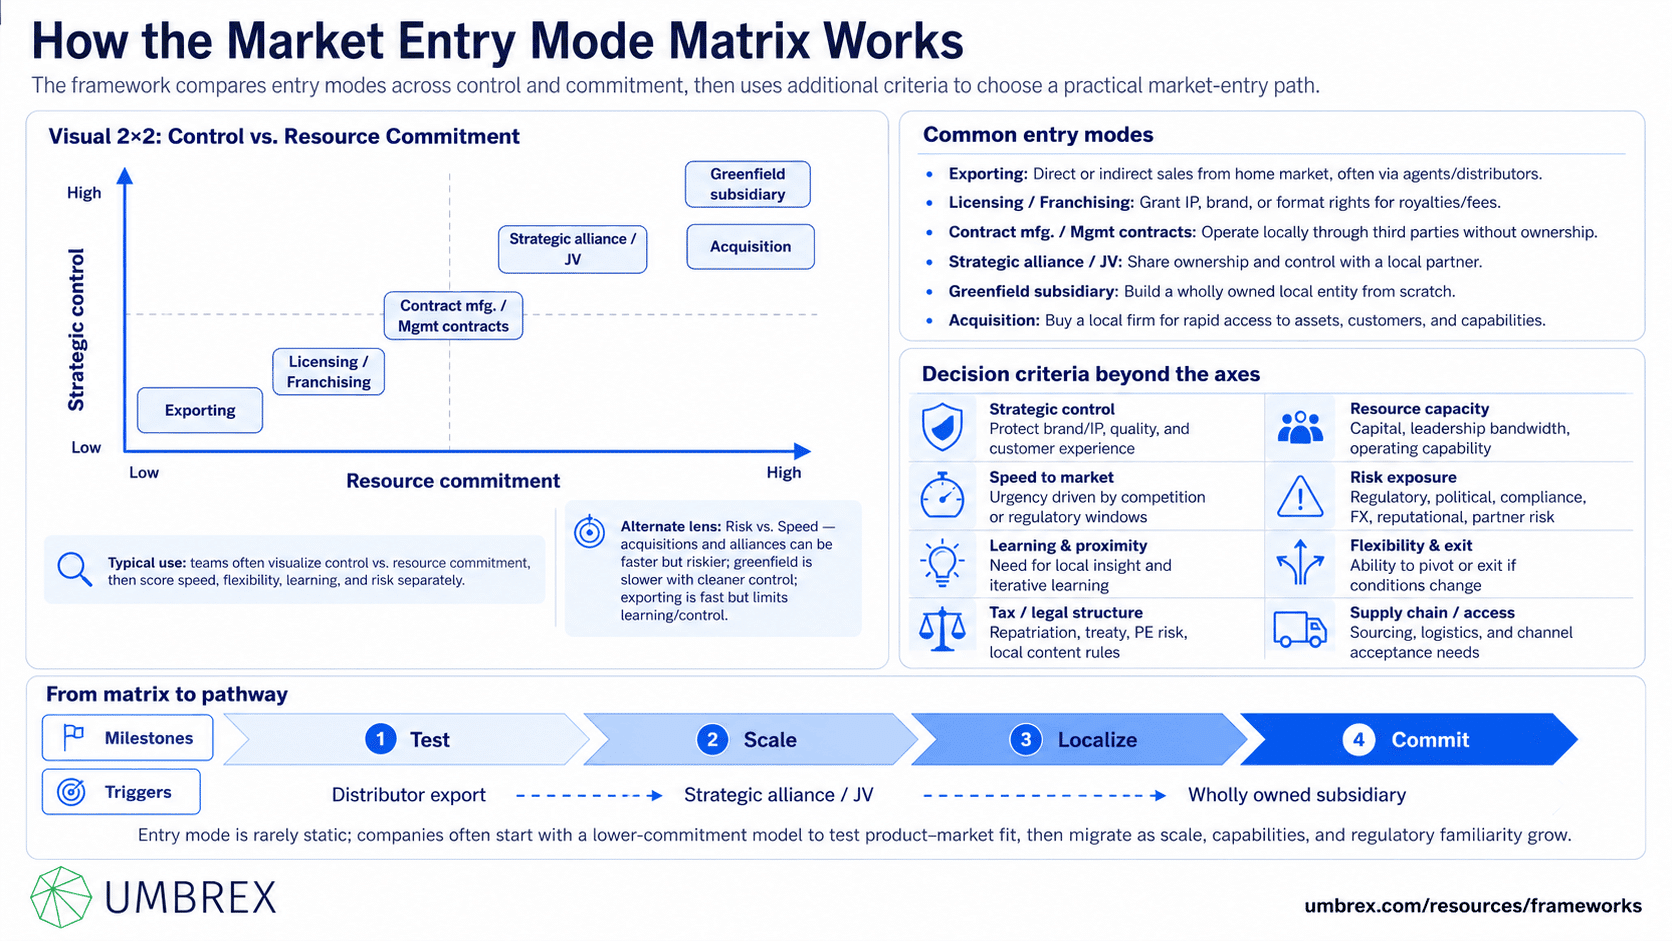
The matrix is typically a 2×2 or a weighted scorecard paired with a map. It compares a set of entry modes on two primary dimensions and a handful of secondary criteria.
Common entry modes
- Exporting: Direct or indirect sales from home market; often via agents or distributors.
- Licensing/Franchising: Grant rights to use IP/brand/format to a local firm for royalties/fees.
- Contract manufacturing/Management contracts: Produce locally through third parties; manage operations without ownership.
- Strategic alliance/Joint venture (JV): Share ownership and control with a local partner.
- Greenfield subsidiary: Establish a wholly owned local entity from scratch.
- Acquisition: Buy a local firm to gain assets, customers, and capabilities quickly.
Typical axes for the matrix
- Control vs. Resource Commitment: How much control you retain over quality, brand, pricing, channels, and IP vs. how much capital, management attention, and fixed cost you commit. Exporting/licensing sit low; acquisitions/greenfield high.
- Risk vs. Speed: Execution and regulatory risk (including IP, compliance, political) vs. speed to market/scale. Acquisitions and alliances can be fast but riskier; greenfield is slower but offers cleaner control; exporting is fast but limits learning/control.
Many teams use control vs. resource commitment as the visual 2×2, then assess speed, flexibility, learning, and risk as scored criteria.
Decision criteria (beyond the axes)
- Strategic control: Need to protect brand/IP, enforce quality, and shape customer experience.
- Resource capacity: Capital availability, leadership bandwidth, and operating capability to build/operate locally.
- Speed to market: Urgency due to competitive dynamics or regulatory windows.
- Risk exposure: Regulatory, political, compliance, FX, reputational, and partner risks.
- Learning & market proximity: Need for deep local insight and iterative improvement.
- Flexibility & exit options: Ability to pivot or exit if conditions change.
- Tax and legal structure: Treaty benefits, profit repatriation, permanent establishment risk, local content rules.
- Supply chain and customer access: Local sourcing, logistics, and channel acceptance requirements.
From matrix to pathway
Entry mode is rarely static. A robust plan defines a pathway: start with a low-commitment mode to test product–market fit (e.g., distributor export), then migrate to a JV or wholly owned subsidiary as scale, capability, and regulatory familiarity grow. The matrix helps you design that path with milestones and triggers.
4. When to Use the Market Entry Mode Matrix
The Market Entry Mode Matrix, specifically how to apply this framework, including evaluating target markets, comparing entry mode options, assessing investment requirements and risks, selecting the appropriate market entry strategy, planning market expansion, and managing international operations.
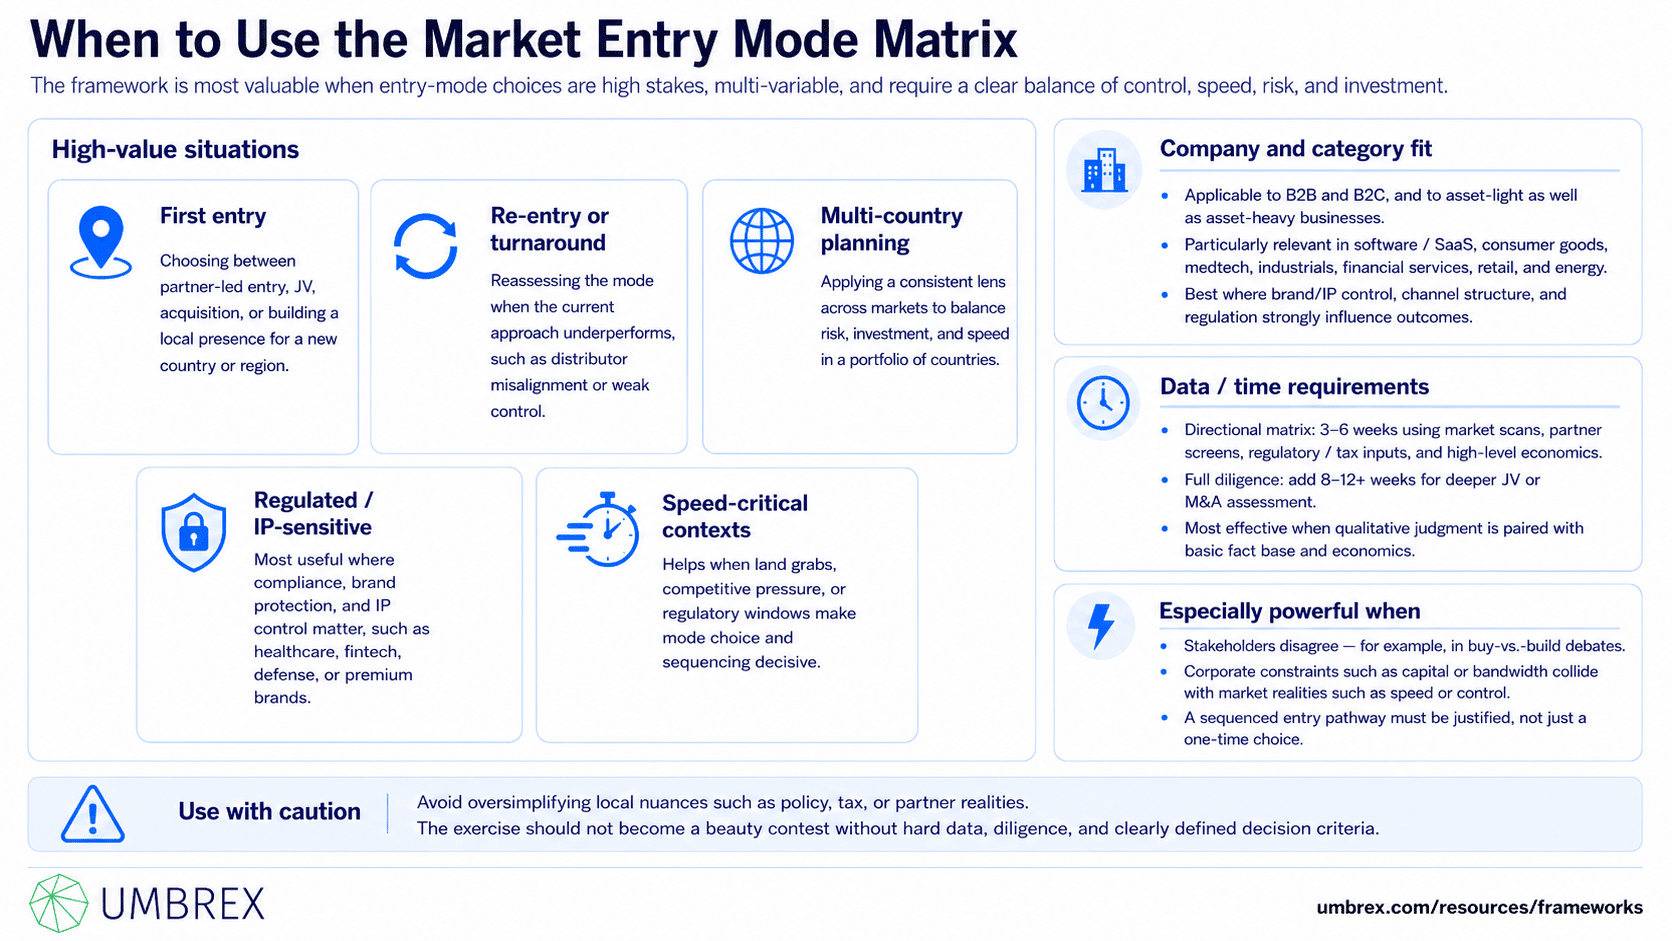
High-value situations:
- First entry into a country/region: Deciding between partner-led entry, JV, acquisition, or building your own presence.
- Re-entry or turnaround: When a current mode underperforms (e.g., distributor misalignment), reassessing alternatives.
- Multi-country portfolio planning: Using a consistent lens to select modes across several markets, balancing risk and investment.
- Regulated or IP-sensitive categories: Where control and compliance matter (healthcare, fintech, defense, premium brands).
- Speed-critical contexts: Competitive land grabs or regulatory windows that make mode and sequencing decisive.
Company and category fit: Applicable to B2B and B2C, asset-light and asset-heavy businesses. Particularly useful where brand/IP control, channel structures, and regulation drive outcomes (software/SaaS, consumer goods, medtech, industrials, financial services, retail, energy).
Data/time requirements: A directional matrix can be built in 3–6 weeks with market scans, partner screens, regulatory/tax inputs, and high-level economics. Full diligence (e.g., for JV/MA) adds 8–12+ weeks.
Especially powerful when: Stakeholders disagree (e.g., “buy vs. build” debates), or when corporate constraints (capital, bandwidth) collide with market realities (speed, control).
Use with caution when: Oversimplified axes obscure critical local nuances (e.g., policy, tax); or when the exercise becomes a “beauty contest” without hard data and diligence.
5. How to Apply the Market Entry Mode Matrix: Step-by-Step
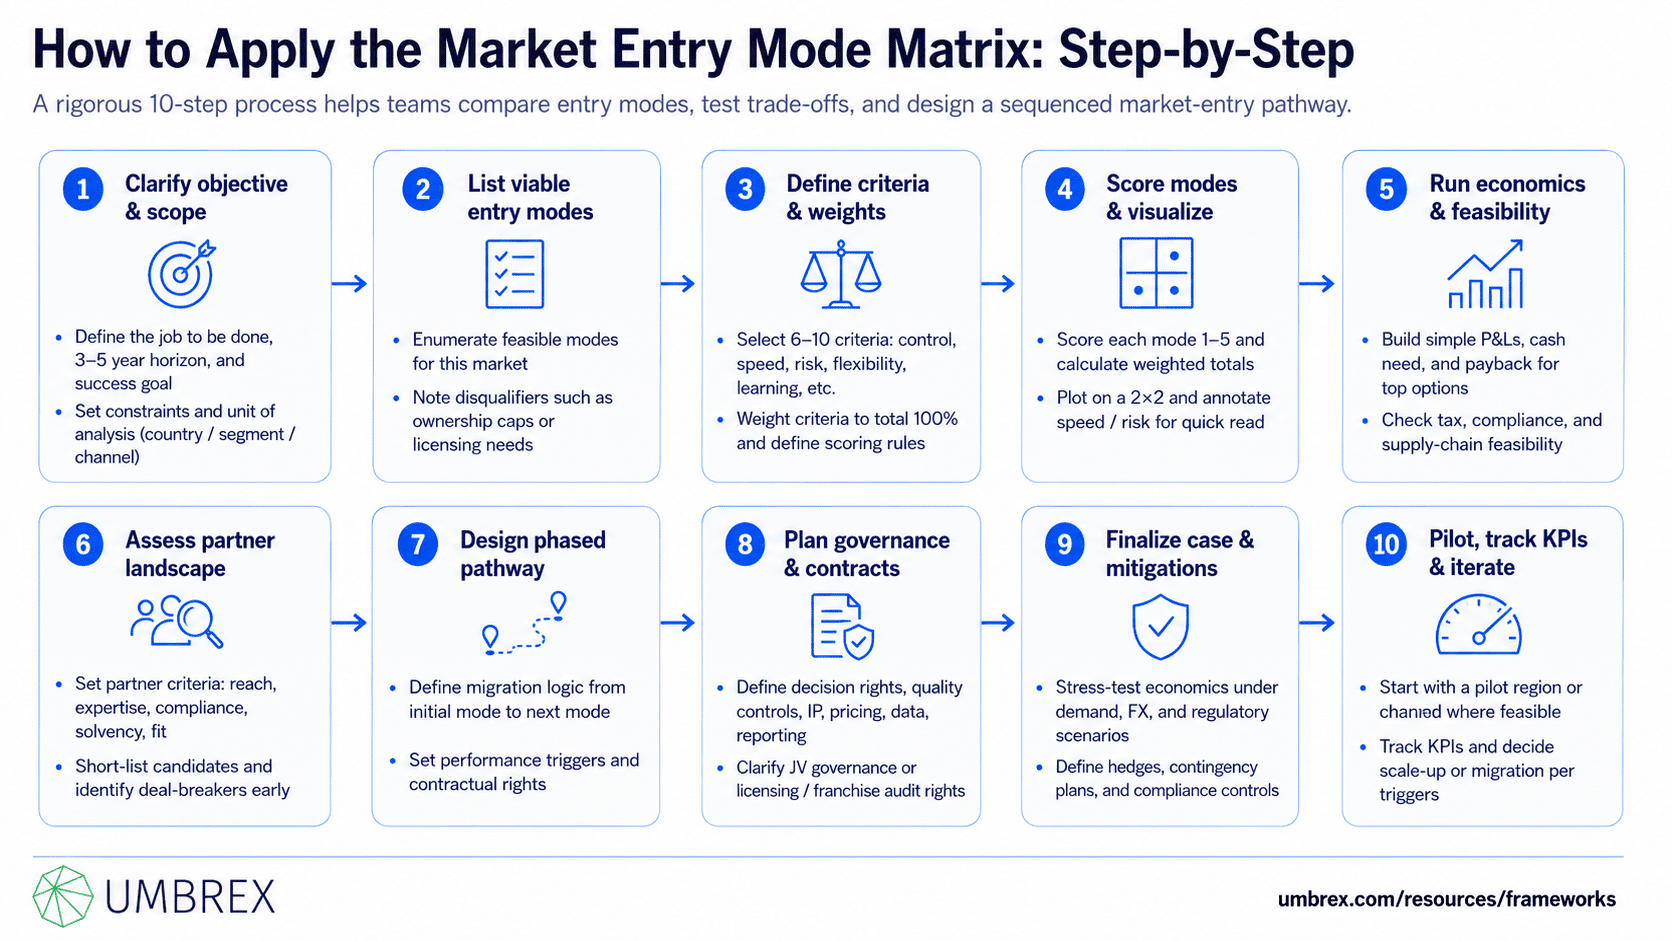
- Clarify the strategic objective and scope.
Define the “job to be done” in the target market (revenue, share, capability building), the time horizon (e.g., 3–5 years), and constraints (capital limits, brand control requirements). Specify unit of analysis (country/segment/channel).
- List viable entry modes for this market.
Based on category norms, regulation, and your capabilities, enumerate feasible modes (export with distributor/agent, licensing/franchising, contract manufacturing, JV, greenfield subsidiary, acquisition, alliance). Note any disqualifiers (e.g., foreign ownership caps, licensing needs).
- Define evaluation criteria and weights.
Select 6–10 criteria (control, resource commitment, speed, risk, flexibility, learning, tax/legal fit, supply/channel access). Weight by importance (summing to 100%). Document definitions to keep scoring consistent.
- Score each mode and visualize the matrix.
Score 1–5 for each criterion; compute weighted totals. Plot modes on a 2×2 (e.g., Control vs. Resource Commitment) to visualize trade-offs. Annotate with speed and risk icons or colors for quick read.
- Run directional economics and feasibility checks.
For top candidates, build simple P&Ls (revenue ramp, gross margin, opex, capex), cash need, and payback. Layer in tax (treaty benefits, PE risk, repatriation), compliance (licenses, data residency), and supply-chain feasibility.
- Assess partner landscape (if partner modes are in play).
Define partner selection criteria (reach, reputation, category expertise, compliance, solvency, cultural fit). Conduct a short-list process and preliminary diligence; identify deal-breakers early.
- Design a phased entry pathway with triggers.
For the chosen mode, define clear migration logic (e.g., Export via distributor → Option to JV in 18–24 months → Buyout rights). Set triggers (revenue, NPS, compliance milestones, partner performance) and contractual rights (call/put options, change-of-control, brand standards).
- Plan governance, contracts, and operating model.
Define decision rights, brand and quality controls, IP protection, pricing/discount policies, data sharing, and reporting. In JVs, clarify board composition, veto rights, and deadlock resolution. In franchises/licensing, codify standards and audit rights.
- Finalize the business case and risk mitigations.
Stress-test economics under scenarios (demand, FX, regulatory shifts). Define hedges (FX, flexible leases), contingency plans (alternate partners), and compliance controls (AML/KYC, data privacy, product approvals).
- Execute pilots, instrument KPIs, and iterate.
Start with a pilot region/channel where feasible. Track leading indicators: time-to-first-revenue, sell-through, service SLAs, NPS/CSAT, partner productivity, compliance metrics. Iterate and decide on scale-up or migration per the triggers.
6. Example: Market Entry Mode Matrix in Action
Context: A $500M premium home-appliance brand (small kitchen appliances) plans to enter India. The brand is design-led with strict quality standards and a “hero SKU” strategy. Objectives: reach $60M revenue in 3 years, protect brand equity, and learn fast. Constraints: limited headquarters bandwidth; moderate capital available.
Viable modes: (1) Export via national distributor, (2) Master franchise for branded stores, (3) Contract manufacturing + distributor, (4) JV with a local appliance company, (5) Greenfield subsidiary (own sales/marketing), (6) Acquisition of a niche premium player.
Criteria & weights: Control (20%), Speed (15%), Resource commitment (15%), Risk (15%), Learning (15%), Channel access (10%), Tax/legal fit (10%).
Scoring (directional):
- Distributor export: Control low, speed high, resources low, risk medium-high (brand execution), learning medium-low.
- Master franchise: Control medium (standards), speed medium, resources low-medium, risk medium (execution), learning low.
- Contract manufacturing + distributor: Control medium, speed medium, resources medium, risk medium (quality), learning medium.
- JV: Control medium-high, speed high (with partner), resources medium-high, risk medium (governance), learning high.
- Greenfield subsidiary: Control high, speed low-medium, resources high, risk medium (execution), learning high.
- Acquisition: Control high, speed high, resources very high, risk high (integration/fit), learning high.
Matrix view: On a Control vs. Resource Commitment 2×2, distributor export sits low/low, greenfield high/high, JV medium-high control/medium-high commitment, acquisition high/high with faster speed but higher risk. Annotating speed and risk flags, the JV and greenfield cluster as promising for control and learning; distributor export is attractive for speed but weak on brand control.
Economics & feasibility: Distributor margin demands compress profitability; premium positioning needs tight execution in modern retail and e-commerce. Acquisition options are overpriced and culturally misaligned. A short-list of potential JV partners includes a respected local premium appliance importer with strong retail relationships.
Decision and pathway: Choose a JV (51/49) with the importer. Start with imported SKUs (12 months), then evaluate local assembly (CKD/SKD) to hit price points. Build-in options: call option to move to majority/wholly owned after Year 4 based on brand standards and revenue triggers; strict brand and quality covenants; e-commerce to be run under global playbook. Pilot in top 8 metros; focus on modern retail + own brand.com; limited pop-up stores for experience.
Outcomes (24 months): $48M run-rate, gross margin within global guardrails; NPS at par with home markets; local assembly of two hero SKUs cut price by 8% without brand dilution. Learning loop established: local insights inform next-gen product adaptations. Board approves step-up to 70% ownership at Year 3 per JV agreement.
7. Strengths and Limitations
Strengths
- Sharpens trade-offs: Makes control, speed, risk, and investment differences explicit.
- Cross-functional alignment: Creates a common language for strategy, legal/tax, supply chain, and commercial teams.
- Pathway thinking: Encourages staged entry with triggers to migrate mode as scale and capability grow.
- Comparable across markets: Enables consistent decisions for multi-country portfolios.
Limitations
- Oversimplification risk: Two axes can’t capture all context (policy nuance, tax, labor, culture); requires deeper diligence.
- Data uncertainty: Scores depend on assumptions and limited data; sensitivity analysis is essential.
- Static snapshot: Without triggers and governance, the chosen mode can ossify even as conditions change.
- Partner dependency: Modes with partners hinge on selection quality and enforceable contracts; missteps are costly.
8. Common Pitfalls (and How to Avoid Them)
- Picking axes that don’t reflect the real decision.
What goes wrong: A pretty 2×2 that doesn’t force the trade-offs you face.
Avoid it: Choose axes (e.g., control vs. commitment) and criteria tailored to your objectives and constraints.
- Conflating channels with entry modes.
What goes wrong: “E-commerce” is a channel, not a mode; you still need a legal/operating presence decision.
Avoid it: Separate channel strategy (where you sell) from entry mode (how you establish presence/control).
- Underestimating tax/legal and compliance.
What goes wrong: Permanent establishment risk, profit repatriation barriers, data localization surprises.
Avoid it: Involve tax and legal early; model structures, treaties, and compliance requirements per mode.
- Weak partner diligence and misaligned incentives.
What goes wrong: Distributor or JV partner underinvests, misrepresents capabilities, or conflicts arise.
Avoid it: Use rigorous partner screens, references, and aligned economics (margins, MDF, KPIs); define exit and control rights.
- No migration plan.
What goes wrong: You get stuck in a suboptimal mode as scale grows.
Avoid it: Predefine triggers and contractual options to shift modes; revisit annually.
- Copy-pasting a mode across markets.
What goes wrong: A mode that worked in Market A fails in Market B due to different policy or channel norms.
Avoid it: Re-run the matrix per market; adjust for CAGE distance, regulation, and competition.
- Ignoring IP and brand protection.
What goes wrong: Licensing or distributor leaks erode brand and IP.
Avoid it: Register IP locally; codify brand standards; include audits, penalties, and termination rights.
9. How the Market Entry Mode Matrix Relates to Other Frameworks
- PESTLE and CAGE Distance: Use PESTLE and CAGE (Cultural, Administrative, Geographic, Economic) to assess market context and distance; feed insights into the criteria and feasibility of modes.
- Porter’s Five Forces: Analyze local industry structure; entry mode must align with channel power, rivalry, and barriers.
- GE–McKinsey / Market Attractiveness–Competitive Strength: Decide which markets to prioritize; then use the entry mode matrix to choose how to enter each.
- Ansoff Product–Market Matrix: Market development moves require an entry mode; combine to plan growth pathways.
- Value Chain: Entry modes determine which activities you internalize vs. partner; the value chain guides make/buy/ally decisions and capability build.
- Scenario Planning and Real Options: Treat entry mode choices as options; set signposts (policy, channel uptake) and triggers to scale or pivot modes.
- M&A and JV Playbooks: If acquisition or JV is chosen, use dedicated diligence and integration/governance frameworks.
10. Key Takeaways
- The Market Entry Mode Matrix compares entry options (export, licensing, JV, greenfield, acquisition, etc.) along control, resource commitment, speed, risk, and learning.
- Pick axes and criteria that reflect your real trade-offs; score modes, then test economics, legal/tax, and partner feasibility.
- Design a phased pathway with triggers to migrate modes as scale and capability grow; bake options into contracts.
- Involve cross-functional experts (strategy, legal/tax, supply chain, commercial) early to avoid surprises.
- Re-run the analysis per market; context and distance matter—what works in one country may fail in another.
- Use alongside PESTLE/CAGE, portfolio matrices, Five Forces, and scenario planning for a complete expansion plan.
11. FAQs About the Market Entry Mode Matrix
What are the most common market entry modes?
Exporting (direct/indirect), licensing/franchising, contract manufacturing/management contracts, strategic alliances and joint ventures, greenfield subsidiaries, and acquisitions. Hybrids are common (e.g., contract manufacturing plus distributor, JV with step-in rights).
Which axes should we use for the matrix?
Most teams use Control vs. Resource Commitment for the 2×2, then score modes on speed, risk, learning, flexibility, and tax/legal fit. In some contexts (e.g., land grabs), Speed vs. Control is more decision-relevant—choose what forces your real trade-offs.
How long does a robust entry mode assessment take?
A directional view: 3–6 weeks (criteria, scoring, high-level economics, partner scan). If a JV or acquisition is shortlisted, full diligence and structuring usually add 8–12+ weeks.
Should we plan to change entry modes over time?
Often yes. Many successful entries start with low-commitment modes to test and learn, then migrate to higher-control modes as scale and capability grow. Define triggers and contractual options (call/put, buyout rights) up front.
How does this differ from market selection frameworks?
Market selection (e.g., GE–McKinsey, CAGE) prioritizes where to play. The entry mode matrix decides how to enter each chosen market, considering control, investment, speed, and risk.
Can startups use this without over-engineering?
Yes. Keep it lean: 5–6 criteria, three mode options, a simple P&L, and clear triggers. Favor modes that preserve cash and learning (e.g., partner-led with strong brand controls) while keeping options to scale.
How do we protect IP and brand in partner-led modes?
Register IP locally, include strict brand/IP clauses with audits and penalties, limit source code or sensitive know-how exposure, and monitor performance. Consider staging access to IP as partner performance earns trust.
