

1. What Is Porter’s Value Chain?
Porter’s Value Chain is a structured way to analyze the set of activities a company performs to create value for customers—from sourcing inputs to servicing the product after sale—and to understand how those activities drive cost and differentiation. By breaking the business into “primary” and “support” activities, leaders can see where advantage is created (or destroyed), identify linkages across functions, and target improvements that reinforce strategy.
Primary activities include inbound logistics, operations, outbound logistics, marketing and sales, and service. Support activities—procurement, technology development, human resource management, and firm infrastructure—enable and strengthen the primary activities. The “margin” is the value delivered minus the collective cost of these activities.
Consultants and executives use the value chain to diagnose cost structure, isolate distinctive capabilities, guide make/buy and partnership decisions, and prioritize operational and digital investments. It is a foundational business-unit strategy tool that connects day-to-day processes to competitive position.
2. Origin and Background
Origin: Introduced by Michael E. Porter in “Competitive Advantage: Creating and Sustaining Superior Performance” (1985).
Porter developed the value chain to move strategy work beyond aggregate financials and org charts to the underlying activities that produce value. He distinguished the internal value chain from the broader “value system” (suppliers → firm → channels → end customer) and emphasized that sustainable advantage stems from how activities fit together, not from any single function in isolation.
The concept gained prominence through business schools and consulting practice because it offers a practical, cross-functional lens to link cost drivers and value drivers to strategic choices like cost leadership, differentiation, and focus.
3. How Porter’s Value Chain Works
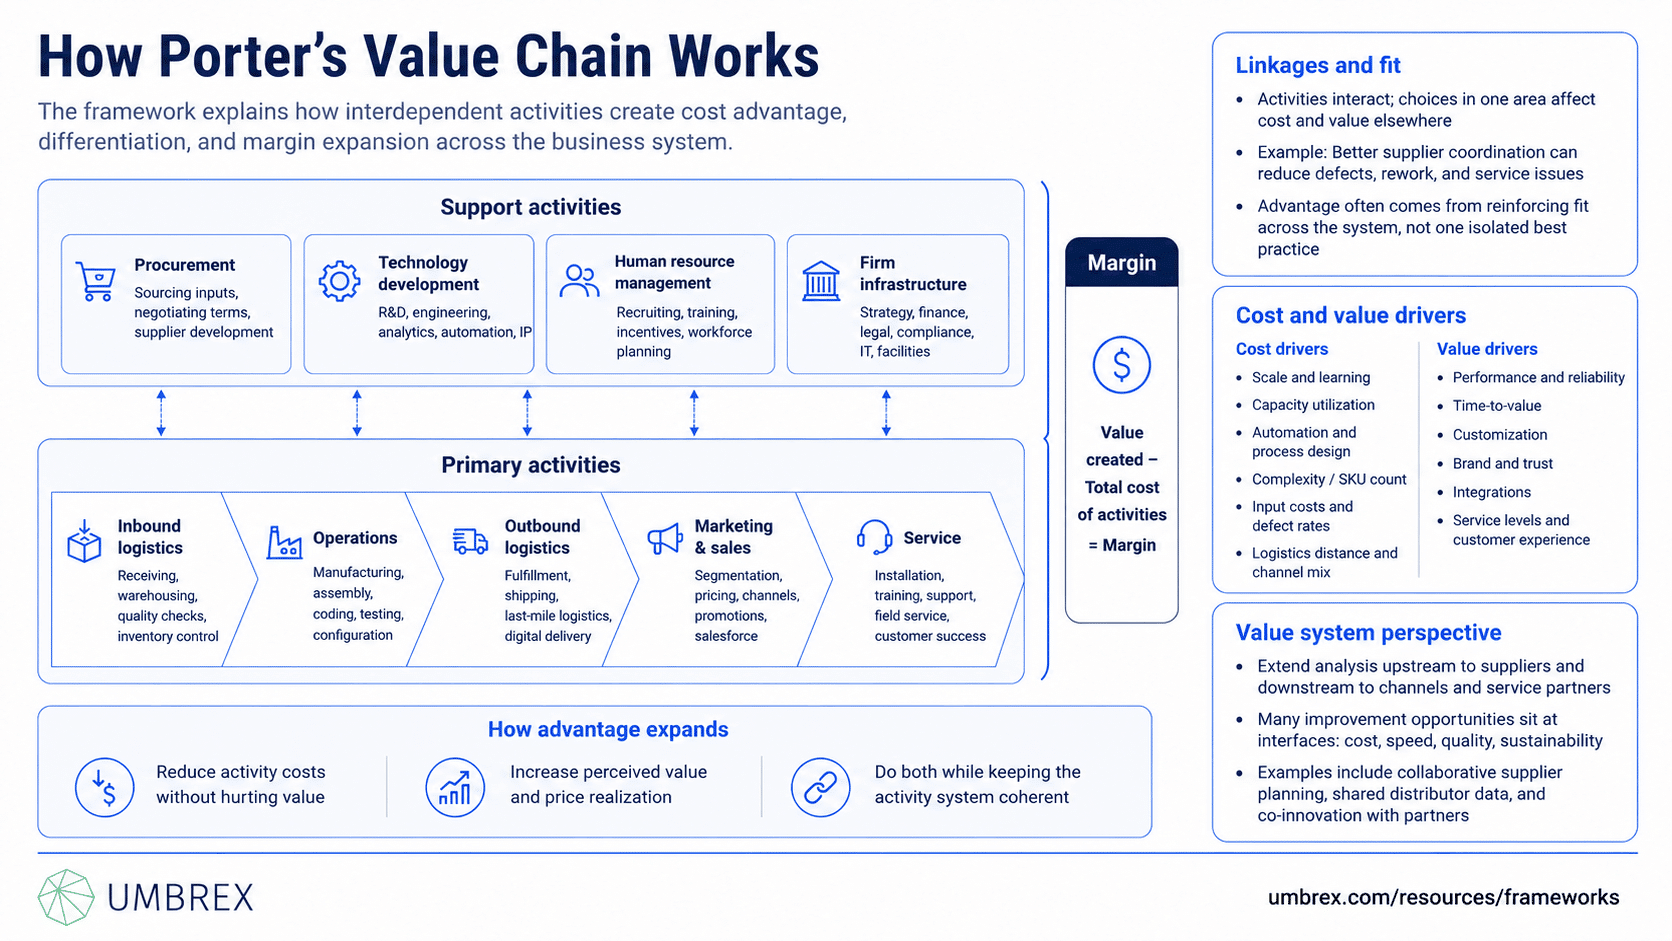
The value chain disaggregates the business into activities, examines their economics and interdependencies, and connects them to sources of competitive advantage.
The activities
- Primary activities:
- Inbound logistics: Receiving, warehousing, and managing inputs (e.g., supplier coordination, quality checks, inventory control).
- Operations: Transforming inputs into the final product (e.g., manufacturing, assembly, coding, testing, configuration).
- Outbound logistics: Distribution to buyers (e.g., order fulfillment, shipping, last-mile logistics, digital delivery).
- Marketing & sales: Communicating and selling the offering (e.g., segmentation, pricing, channels, promotions, salesforce).
- Service: Enhancing/maintaining value post-sale (e.g., installation, training, support, field service, customer success).
- Support activities:
- Procurement: Sourcing inputs, negotiating terms, should-cost analysis, supplier development.
- Technology development: R&D, process engineering, data and analytics, automation, IP.
- Human resource management: Recruiting, training, incentives, workforce planning.
- Firm infrastructure: Strategy, finance, legal, compliance, IT, facilities, management systems.
Linkages and fit
Activities interact. Choices in one area affect costs and value elsewhere (e.g., investing in supplier relationships can reduce inbound defects, which lowers rework costs in operations and improves service metrics). Advantage often emerges from fit—a reinforcing system of activities aligned to a chosen strategy—rather than from any single best practice.
Cost drivers and value drivers
- Cost drivers: Scale and learning effects, capacity utilization, process design and automation, complexity/SKU count, asset intensity, input costs, defect and return rates, logistics distances, channel mix.
- Value drivers: Product performance and reliability, time-to-value, customization, brand and trust, ecosystem integrations, service levels, customer experience, compliance/quality.
Margin logic
Porter’s simple equation—Value created minus total cost of activities equals Margin—shifts the discussion to where and how to expand the gap. You can widen it by reducing costs per activity (without hurting value), increasing perceived value (and price realization) through differentiation, or both, provided the activity system remains coherent.
Value chain vs. value system
The value system extends analysis upstream (suppliers) and downstream (channels, service partners). Many opportunities—cost reductions, speed, quality, sustainability—reside at these interfaces (e.g., collaborative planning with suppliers, shared data with distributors, co-innovation with platforms).
4. When to Use the Value Chain
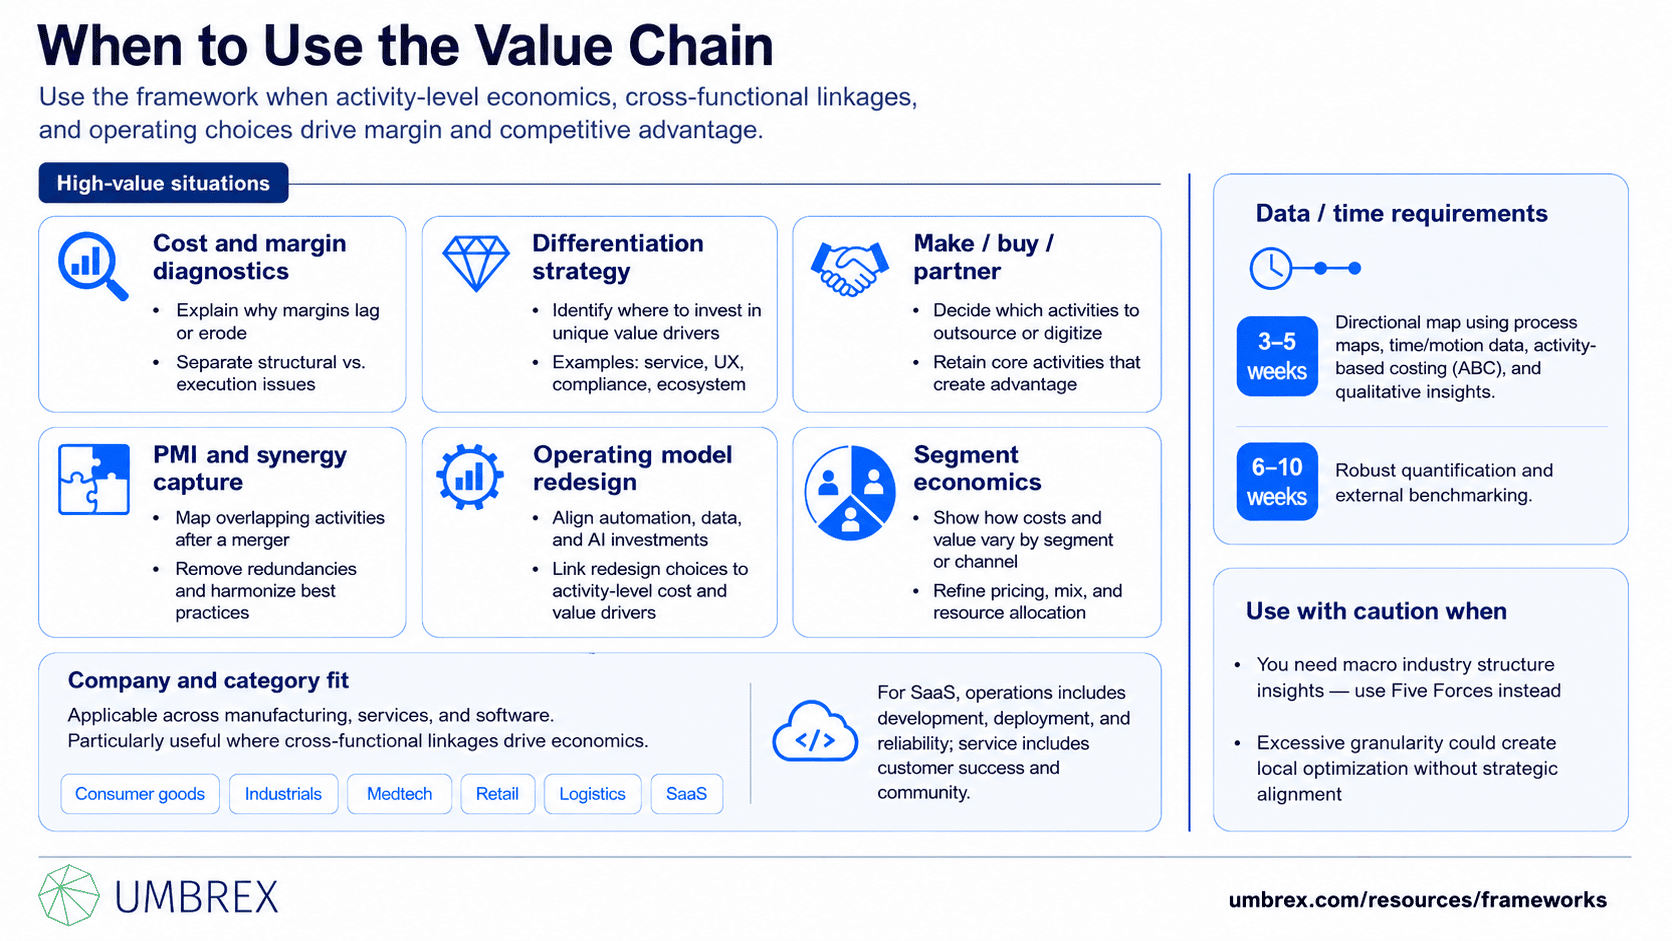
High-value situations:
- Cost and margin diagnostics: Understand why margins lag or erode; pinpoint structural vs. execution issues.
- Differentiation strategy: Identify where to invest to elevate unique value drivers (e.g., service, UX, compliance, ecosystem).
- Make/buy/partner decisions: Decide which activities to outsource or digitize, and which to keep as core.
- Post-merger integration and synergy capture: Map overlapping activities, eliminate redundancies, harmonize best practices.
- Operating model redesign and digital transformation: Align automation, data, and AI investments with activity-level value and cost drivers.
- Segment economics: Reveal how activity costs and value vary by segment/channel to refine pricing and mix.
Company and category fit: Works for manufacturing, services, and software—with adaptations (e.g., “operations” in SaaS covers development, deployment, and reliability; “service” includes customer success and community). Particularly useful where cross-functional linkages drive economics (consumer goods, industrials, medtech, retail, logistics, SaaS).
Data/time requirements: A directional map can be built in 3–5 weeks using process maps, time/motion data, activity-based costing (ABC), and qualitative insights. Robust quantification and external benchmarks may take 6–10 weeks.
Use with caution when: You need macro industry structure insights (use Five Forces), or when excessive granularity risks local optimization without strategic alignment.
5. How to Apply Porter’s Value Chain: Step-by-Step
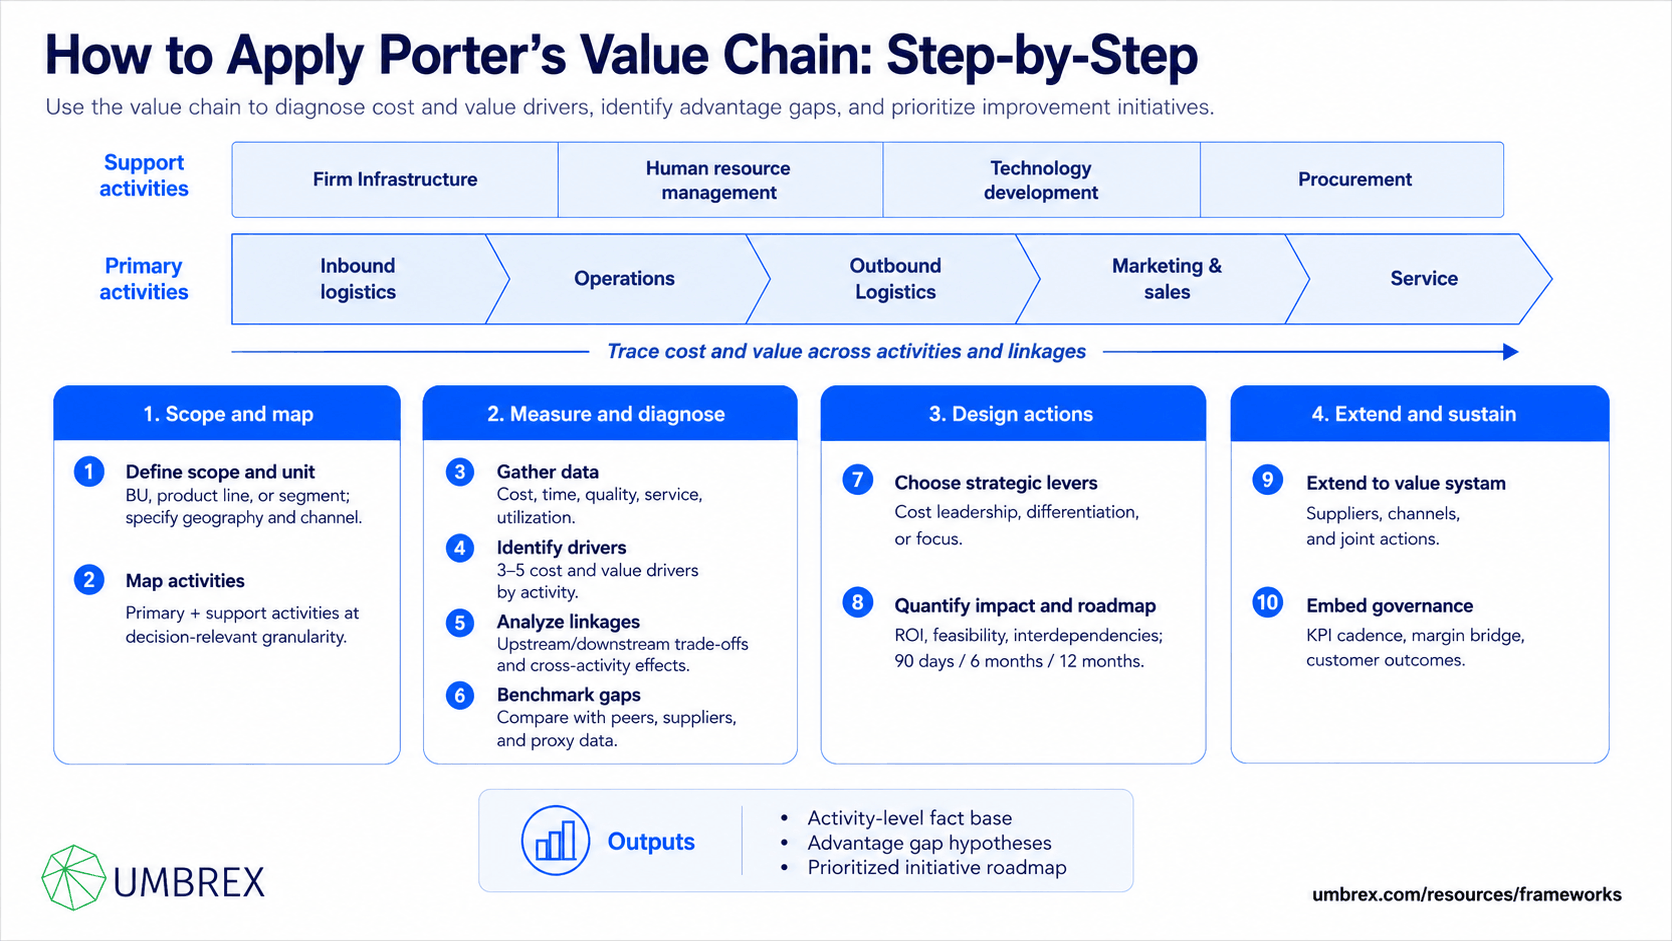
- Define scope and the unit of analysis.
Choose a business unit, product line, or segment. Be explicit about geographies and channels. Avoid mixing heterogeneous businesses that obscure drivers.
- Map primary and support activities.
Document activities at decision-relevant granularity (e.g., “final assembly,” not just “operations”). Use process maps, swim lanes, and SIPOC (Suppliers–Inputs–Process–Outputs–Customers) to capture inputs, outputs, handoffs, and systems.
- Gather data on costs, time, quality, and outcomes.
Quantify each activity with:
- Cost pools (labor, materials, overhead) using activity-based costing where feasible.
- Throughput and cycle times; yield/defect rates; rework; inventory turns.
- Service levels (SLAs), Net Promoter Score (NPS), first-contact resolution, on-time delivery.
- Asset utilization; return/warranty rates; freight and duty; marketing CAC by channel.
Segment metrics where they vary meaningfully (by SKU family, channel, or customer tier).
- Identify cost and value drivers by activity.
For each activity, list the 3–5 variables that most drive cost and value. Note where complexity creeps in (e.g., long tail SKUs) and where customers actually notice (e.g., service response time vs. generic feature counts).
- Analyze linkages and trade-offs.
Trace how upstream choices affect downstream costs and value (e.g., procurement specs → scrap in operations → service calls). Identify where improving one activity allows savings elsewhere (e.g., better forecasting → lower expedite fees).
- Benchmark and hypothesize advantage gaps.
Use external benchmarks, supplier quotes, and best-practice scans to assess where you are above/below peers. When direct competitor data is unavailable, use proxies (e.g., public cost drivers, lead times, service levels).
- Choose strategic levers and design initiatives.
Align with your strategic choice (cost leadership, differentiation, focus). Examples:
- Cost: Design-to-cost, SKU rationalization, automation, vendor consolidation, network redesign, self-service channels.
- Differentiation: Premium materials, reliability engineering, service redesign, ecosystem integrations, brand experience.
- Focus: Segment-specific features, compliance capabilities, specialized channel partnerships.
Include make/buy/partner decisions and digital enablers (analytics, RPA, AI, IoT).
- Quantify impact and sequence the roadmap.
Model initiative impacts on cost and value (price realization, retention). Prioritize by ROI, feasibility, and interdependencies. Sequence in waves (90 days, 6 months, 12 months) with owners and KPIs.
- Extend to the value system.
Engage key suppliers and channels where joint action creates outsized gains (e.g., vendor-managed inventory, shared demand signals, co-marketing, reverse logistics). Align incentives and data sharing.
- Embed governance and measurement.
Stand up a cadence to track activity-level KPIs, margin bridges, and customer outcomes. Adjust initiatives while preserving strategic coherence; avoid reverting to silo optimizations.
6. Example: Porter’s Value Chain in Action
Context: A $600M medical devices company (single-use surgical instruments) faces 300 bps margin erosion over two years. Freight premiums are rising, scrap rates are high in sterilization, and competitor reps are winning on service responsiveness and clinical training.
Value chain mapping:
- Inbound logistics: Multiple small suppliers; frequent expedites; limited incoming quality checks.
- Operations: Assembly in two regions; sterilization outsourced to a single distant provider; scrap at 6.5% (benchmark ~3%).
- Outbound logistics: Central DC with high airfreight for rush hospital orders; inconsistent ATP (available-to-promise).
- Marketing & sales: Strong KOL relationships but poorly segmented pricing; training content fragmented; reps spend time resolving service issues.
- Service: Field support response times vary widely; limited remote support; high return rates for packaging damage.
- Support activities: Procurement fragmented; limited should-cost capability; technology development focused on new SKUs, not process; HR has no formal rep training curriculum; infrastructure: weak S&OP, disconnected planning tools.
Findings and linkages:
- Supplier variability + light incoming QC → higher assembly defects → rework and sterilization scrap.
- Lumpy production + weak S&OP → stockouts → airfreight rushes → margin erosion.
- Packaging failures → returns → service burden → sales time diverted from growth activities.
- Training content gaps → hospitals perceive lower clinical support → competitor win rate advantage in complex procedures.
Initiatives (aligned to a defendable differentiation + cost discipline strategy):
- Procurement and quality: Consolidate to preferred suppliers with PPAP-style qualification; implement incoming QC; build should-cost models to reset price and spec.
- Operations and network: Dual-source sterilization with a nearer provider; introduce in-line error-proofing; redesign packaging for drop resistance; reduce SKU variants by 15%.
- Planning and logistics: Implement integrated S&OP; set ATP rules; shift from air to deferred ground for 60% of rush orders via inventory positioning; vendor-managed inventory at top 50 hospitals.
- Service and sales enablement: Launch a clinical training academy; standardize remote support; create a rapid-response field tier with SLA commitments; centralize case-study library for reps.
- Digital and data: Deploy IoT condition monitoring on sterilization batches; analytics for scrap root cause; CRM enhancements for service-to-sales handoffs.
Outcomes (12 months): Sterilization scrap drops to 3.1%; freight premiums fall 40%; packaging returns cut by half; gross margin improves 220 bps; win rate in complex procedures increases 7 points; rep selling time up 12% due to fewer service escalations. The company sustains a service-led differentiation while tightening cost discipline across the chain.
7. Strengths and Limitations
Strengths
- Activity-level clarity: Turns strategy into concrete activities, costs, and outcomes—actionable for operators.
- Reveals linkages: Highlights cross-functional interdependencies where advantage is created.
- Strategy alignment: Connects operational levers to cost leadership or differentiation choices.
- Partner-ready: Extends naturally to suppliers and channels (value system) for joint improvements.
- Versatile: Adaptable to manufacturing, services, and software/digital businesses.
Limitations
- Snapshot risk: Can be static if not refreshed; market and technology shifts alter where value is created.
- Data intensity: Requires reliable activity-level costs and outcomes; weak data can mislead priorities.
- Local optimization trap: Improving an activity in isolation can harm the system if linkages and strategy aren’t considered.
- Benchmark opacity: Competitor activity data is hard to obtain; proxies and judgment are needed.
- Intangible value: Brand, community, and ecosystem effects can be underrepresented without careful design.
8. Common Pitfalls (and How to Avoid Them)
- Treating the value chain like an org chart.
What goes wrong: Functions defend turf; real activities and handoffs are obscured.
Avoid it: Map processes end-to-end; name activities, not departments; include cross-functional teams in workshops.
- Too high-level to act.
What goes wrong: Labels (e.g., “operations”) without drivers; no leverage points identified.
Avoid it: Go to decision-relevant granularity; quantify costs, times, and quality metrics by activity.
- Ignoring support activities.
What goes wrong: Procurement, HR, and tech are afterthoughts; root causes are missed.
Avoid it: Treat support activities as value creators; include them in cost/value driver analysis.
- No segment or channel lens.
What goes wrong: Averages hide profit pools; pricing and service are misaligned.
Avoid it: Segment the chain where economics differ (SKU families, channels, tiers); tailor plays.
- Optimizing parts, not the system.
What goes wrong: Savings in one activity increase costs downstream (e.g., cheap packaging → higher returns).
Avoid it: Analyze linkages; use total landed cost and end-to-end metrics.
- Jumping to technology first.
What goes wrong: Tools without redesigned processes; value capture disappoints.
Avoid it: Redesign processes, then digitize; link tech to clear activity-level KPIs and paybacks.
- One-and-done study.
What goes wrong: Momentum fades; improvements regress.
Avoid it: Embed a governance cadence with dashboards, owners, and quarterly reviews.
9. How Porter’s Value Chain Relates to Other Frameworks
- Porter’s Five Forces: Five Forces assesses industry structure and profit pools; the value chain shows how to build advantage within that structure by configuring activities.
- Porter’s Generic Strategies: Cost leadership and differentiation are realized through coherent activity systems; the value chain is the design blueprint.
- GE–McKinsey / Market Attractiveness–Competitive Strength: Portfolio tools decide where to invest across units; the value chain guides how to improve each unit’s position.
- BCG Growth–Share Matrix: Allocates resources by growth/share; value chain initiatives enhance cash generation or build leadership in chosen businesses.
- Blue Ocean Strategy (Value Curve): The value curve shows where to eliminate/reduce/raise/create factors; the value chain operationalizes those choices across activities.
- Lean, Six Sigma, and Theory of Constraints: Methods to improve specific activities (waste, defects, bottlenecks); the value chain ensures improvements align with strategy and linkages.
- Business Model Canvas: High-level model of how a business creates/captures value; the value chain provides the operational detail behind key activities, partners, and cost structure.
- VRIO/Core Competence: Test whether activity-based capabilities are valuable, rare, inimitable, and organized; focus investment on those that underpin advantage.
- Value Stream Mapping: A process-improvement map (often in manufacturing/service). Use it within “operations” or “service” activities; the value chain is broader and strategic.
10. Key Takeaways
- Porter’s Value Chain breaks the business into activities to reveal where cost and differentiation advantages arise—and how they interact.
- Advantage comes from a coherent system of activities and linkages, not isolated best practices; align initiatives to strategy.
- Quantify activity-level economics and outcomes; segment where economics differ; avoid optimizing parts at the expense of the whole.
- Extend analysis to the value system—suppliers and channels are often where the biggest gains sit.
- Use the value chain alongside Five Forces, Generic Strategies, and improvement methods (Lean/Six Sigma) to move from diagnosis to results.
- Embed governance and refresh; the map should evolve as markets, technology, and capabilities change.
11. FAQs About Porter’s Value Chain
Is the value chain still relevant in digital and SaaS businesses?
Yes. While activities look different (e.g., operations = development, deployment, reliability), the logic holds: map activities, quantify costs and outcomes, analyze linkages (e.g., architecture decisions → support burden), and align with strategy. Include customer success, data/ML pipelines, and ecosystem integrations explicitly.
How is a value chain different from a supply chain or value stream map?
A supply chain focuses on the flow of physical goods across firms; a value stream map details process steps to eliminate waste. Porter’s value chain is broader and strategic, covering all activities (including marketing, service, and support functions) and their role in competitive advantage.
Can services and software use this framework effectively?
Absolutely. Adapt activity labels (e.g., “operations” to “service delivery, development, and reliability”), and emphasize customer experience, onboarding, and lifecycle service. Many service advantages (response times, first-contact resolution, personalization) are value-chain outcomes.
How long does a value chain project take?
A directional assessment can be completed in 3–5 weeks. A robust effort with activity-based costing, external benchmarks, initiative business cases, and an integrated roadmap typically takes 6–10 weeks, often aligned to annual planning.
How deep should we go—what level of granularity is right?
Go to the level at which you can make decisions and assign owners (e.g., “final assembly calibration” vs. “operations”). As a rule of thumb, 20–40 activities for a business unit is sufficient; segment where economics differ materially.
How do we incorporate partners and platforms?
Extend to the value system. Map critical partner activities (e.g., supplier quality, distributor service levels, platform APIs) and define joint KPIs and incentives. Many improvements—cost and differentiation—require coordinated changes across firm boundaries.
