

1. What Is the GE–McKinsey Portfolio Matrix?
The GE–McKinsey Portfolio Matrix is a multi-factor portfolio analysis tool that helps leaders allocate resources across business units, product lines, or markets. It maps each unit on a 3×3 (nine-box) grid using two composite axes: Industry Attractiveness and Business Unit Strength. Unlike the simpler BCG Matrix, both axes are built from weighted criteria tailored to your context.
In practical terms, the matrix guides “where to invest, hold, or harvest” by making explicit how attractive each arena is and how strong your competitive position is within it. Units in the “invest/grow” cells (high attractiveness, strong position) merit disproportionate capital; those in “harvest/divest” cells (low attractiveness, weak position) should be minimized or exited unless strategic synergies justify them.
This is a foundational market and portfolio framework. Consultants and executives use it in annual planning, corporate strategy, portfolio reviews, and M&A screening to create a shared, evidence-based view of priorities and the funding mix.
2. Origin and Background
Origin: Developed by McKinsey & Company in the early 1970s for General Electric (GE). It is often called the GE–McKinsey Nine-Box Matrix or the Business Screen.
The matrix emerged as an evolution of portfolio thinking. GE needed a more nuanced planning tool than the then-popular BCG Growth–Share Matrix, one that incorporated multiple drivers of industry attractiveness (e.g., profit pool structure, regulation) and business strength (e.g., capabilities, customer loyalty), rather than relying on single proxies like growth and relative share.
It became widely known through GE’s planning processes, McKinsey’s client work, and business school curricula. Its durability stems from its flexibility: users choose criteria and weights appropriate to their industries and strategic questions.
3. How the GE–McKinsey Matrix Works
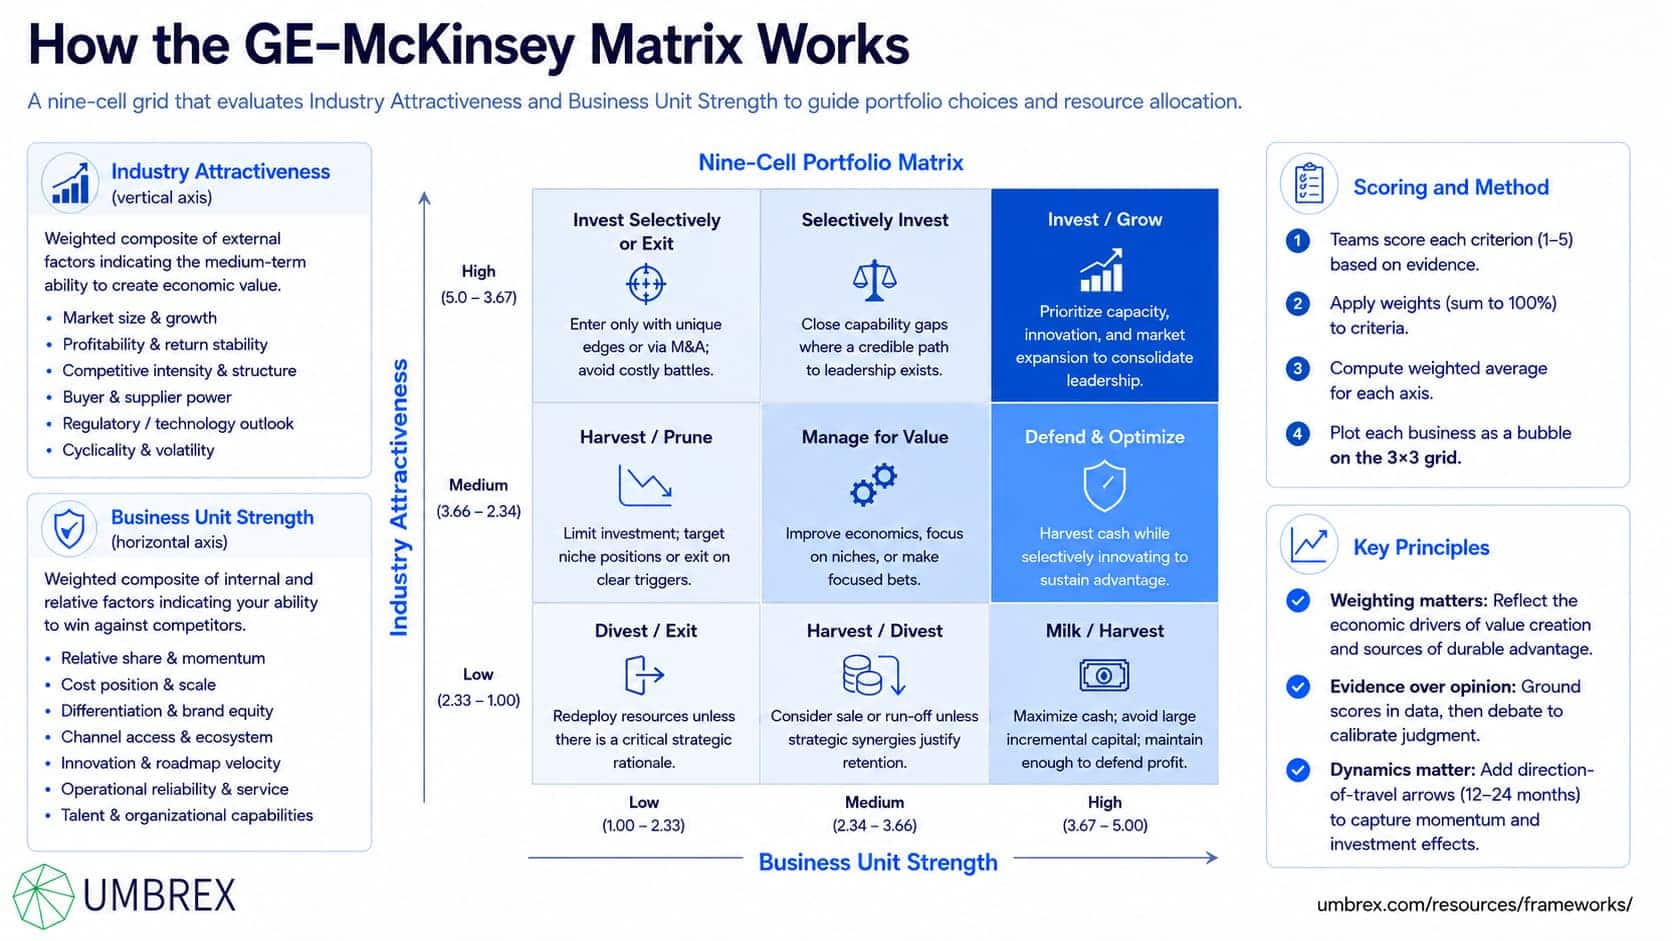
The matrix is a nine-cell grid with Industry Attractiveness on the vertical axis (low, medium, high) and Business Unit Strength on the horizontal axis (low, medium, high). Each point on the grid is a business, product line, geography, or category.
The axes and their components
- Industry Attractiveness (vertical): A weighted composite of external factors indicating the medium-term ability to create economic value in a defined market. Typical criteria:
- Market size and growth (near- and medium-term)
- Profitability and return stability (margins, ROIC norms)
- Competitive intensity and structure (fragmentation, consolidation pace)
- Buyer and supplier power (switching costs, concentration)
- Regulatory/technology outlook (barriers, subsidies, disruption risk)
- Cyclicality and volatility (demand shocks, pricing power)
- Business Unit Strength (horizontal): A weighted composite of internal and relative factors indicating your ability to win against competitors. Typical criteria:
- Relative market share and momentum (wins/losses vs. key rivals)
- Cost position and scale (experience effects, asset utilization)
- Differentiation and brand equity (NPS/loyalty, switching costs)
- Channel access and partner ecosystem strength
- Innovation and product roadmap velocity (time-to-market, IP)
- Operational reliability and service (quality, delivery, uptime)
- Talent and organizational capabilities (coverage, specialized skills)
Teams score each criterion (e.g., 1–5), apply weights (summing to 100%), and compute a weighted average for each axis. The bubbles on the grid are typically sized by revenue or operating cash flow to visualize scale.
The nine cells and typical strategic postures
- High Attractiveness × High Strength (top-right): Invest/Grow. Prioritize capacity, innovation, and market expansion to consolidate leadership.
- High Attractiveness × Medium Strength: Selectively Invest. Close capability gaps where a credible path to leadership exists; consider partnerships or acquisitions.
- High Attractiveness × Low Strength: Invest Selectively or Exit. Enter only with unique edges or via M&A; otherwise, avoid expensive share fights.
- Medium Attractiveness × High Strength: Defend and Optimize. Harvest cash while selectively innovating to sustain advantage.
- Medium Attractiveness × Medium Strength: Manage for Value. Improve economics, focus on niches, or make focused bets.
- Medium Attractiveness × Low Strength: Harvest/Prune. Limit investment; target niche positions or exit on clear triggers.
- Low Attractiveness × High Strength: Milk/Harvest. Maximize cash; avoid large incremental capital; maintain enough to defend profit.
- Low Attractiveness × Medium Strength: Harvest/Divest. Consider sale or run-off unless strategic synergies justify retention.
- Low Attractiveness × Low Strength (bottom-left): Divest/Exit. Redeploy resources unless there is a critical strategic rationale.
Making it concrete
- Weighting matters: The matrix is only as good as the criteria and weights. They should reflect economic drivers of value creation and sources of durable advantage in your category.
- Evidence over opinion: Scores should be grounded in data (market reports, ROIC benchmarks, win/loss, customer metrics), then debated to calibrate judgment.
- Dynamics and arrows: Adding direction-of-travel arrows (e.g., expected movement over 12–24 months) helps capture momentum and investment effects.
4. When to Use the GE–McKinsey Matrix
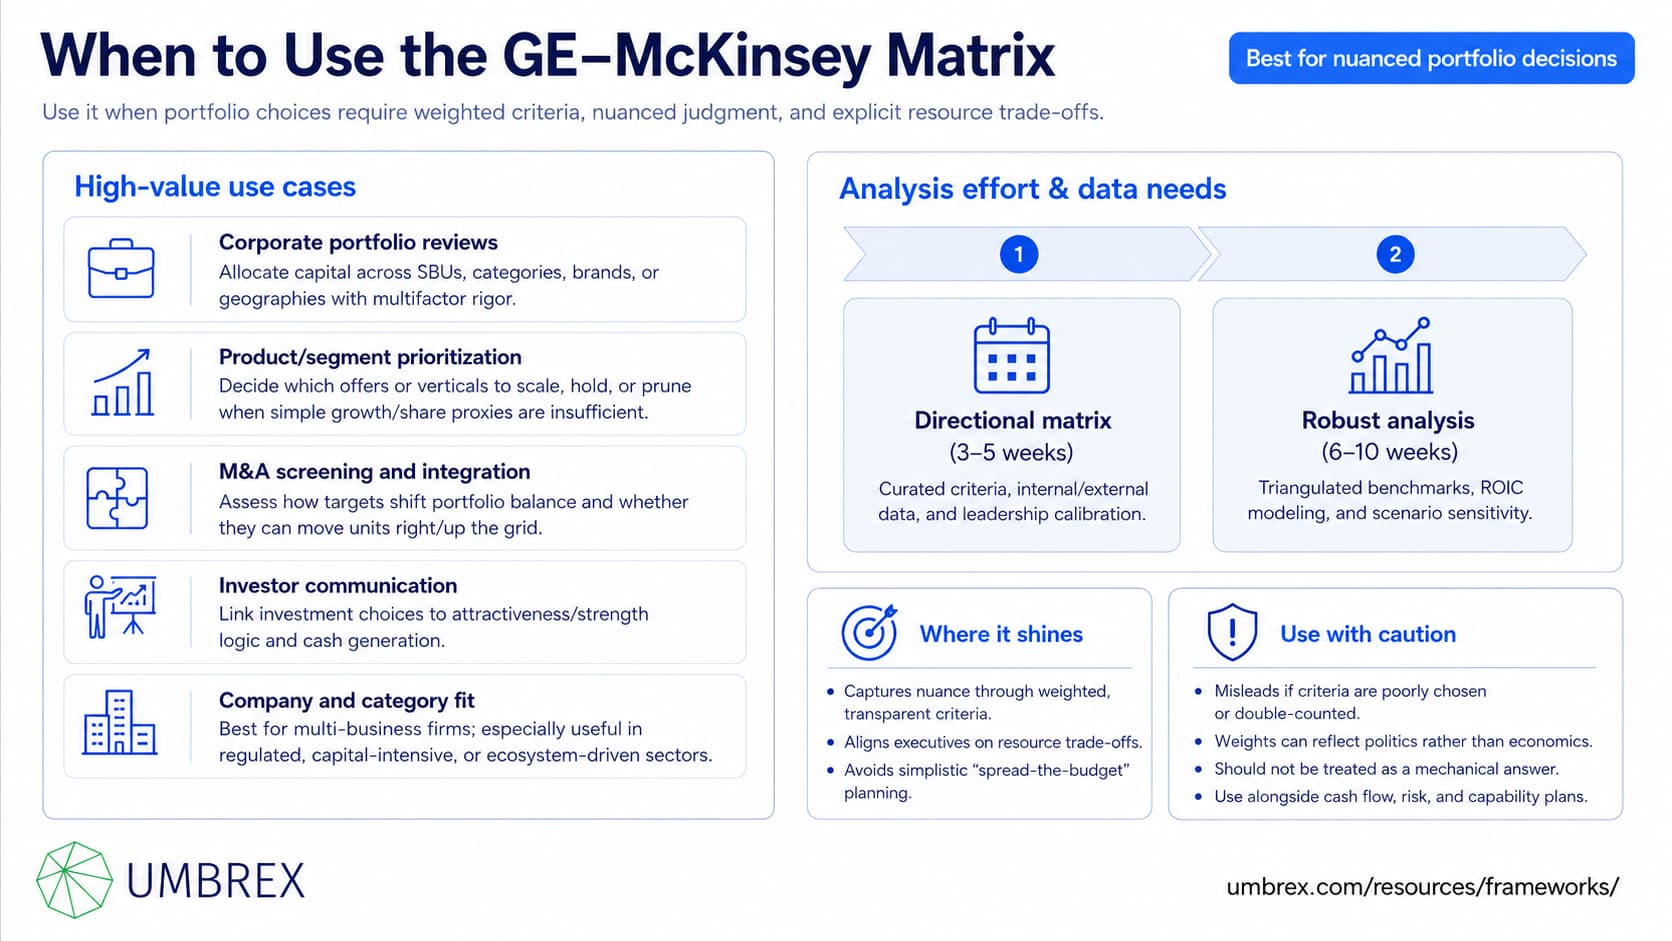
High-value use cases:
- Corporate portfolio reviews: Allocate capital across SBUs, categories, brands, or geographies with multifactor rigor.
- Product/segment prioritization: Choose which offers or verticals to scale, hold, or prune when single proxies (growth/share) are insufficient.
- M&A screening and integration: Assess how targets alter portfolio balance and whether they can shift units right/up the grid.
- Investor communication: Provide a clear narrative linking investment to attractiveness/strength logic and cash generation.
Company and category fit: Useful for multi-business firms or those with multiple meaningful offerings. Particularly valuable in regulated or capital-intensive industries (healthcare, energy, industrials, financial services) where attractiveness depends on more than growth, and in tech where capabilities beyond share (ecosystems, data moats) drive strength.
Data/time requirements: A directional matrix can be built in 3–5 weeks with curated criteria, internal/external data, and leadership calibration. A robust version (with triangulated benchmarks, ROIC modeling, and scenario sensitivity) typically takes 6–10 weeks.
Where it shines: Capturing nuance via weighted, transparent criteria; aligning executives on resource trade-offs; avoiding simplistic “spread-the-budget” planning.
Where it can mislead: If criteria are poorly chosen or double-counted; if weights reflect politics not economics; or if the matrix is treated as a mechanical answer instead of a decision aid integrated with cash flow, risk, and capability plans.
5. How to Apply the GE–McKinsey Matrix: Step-by-Step
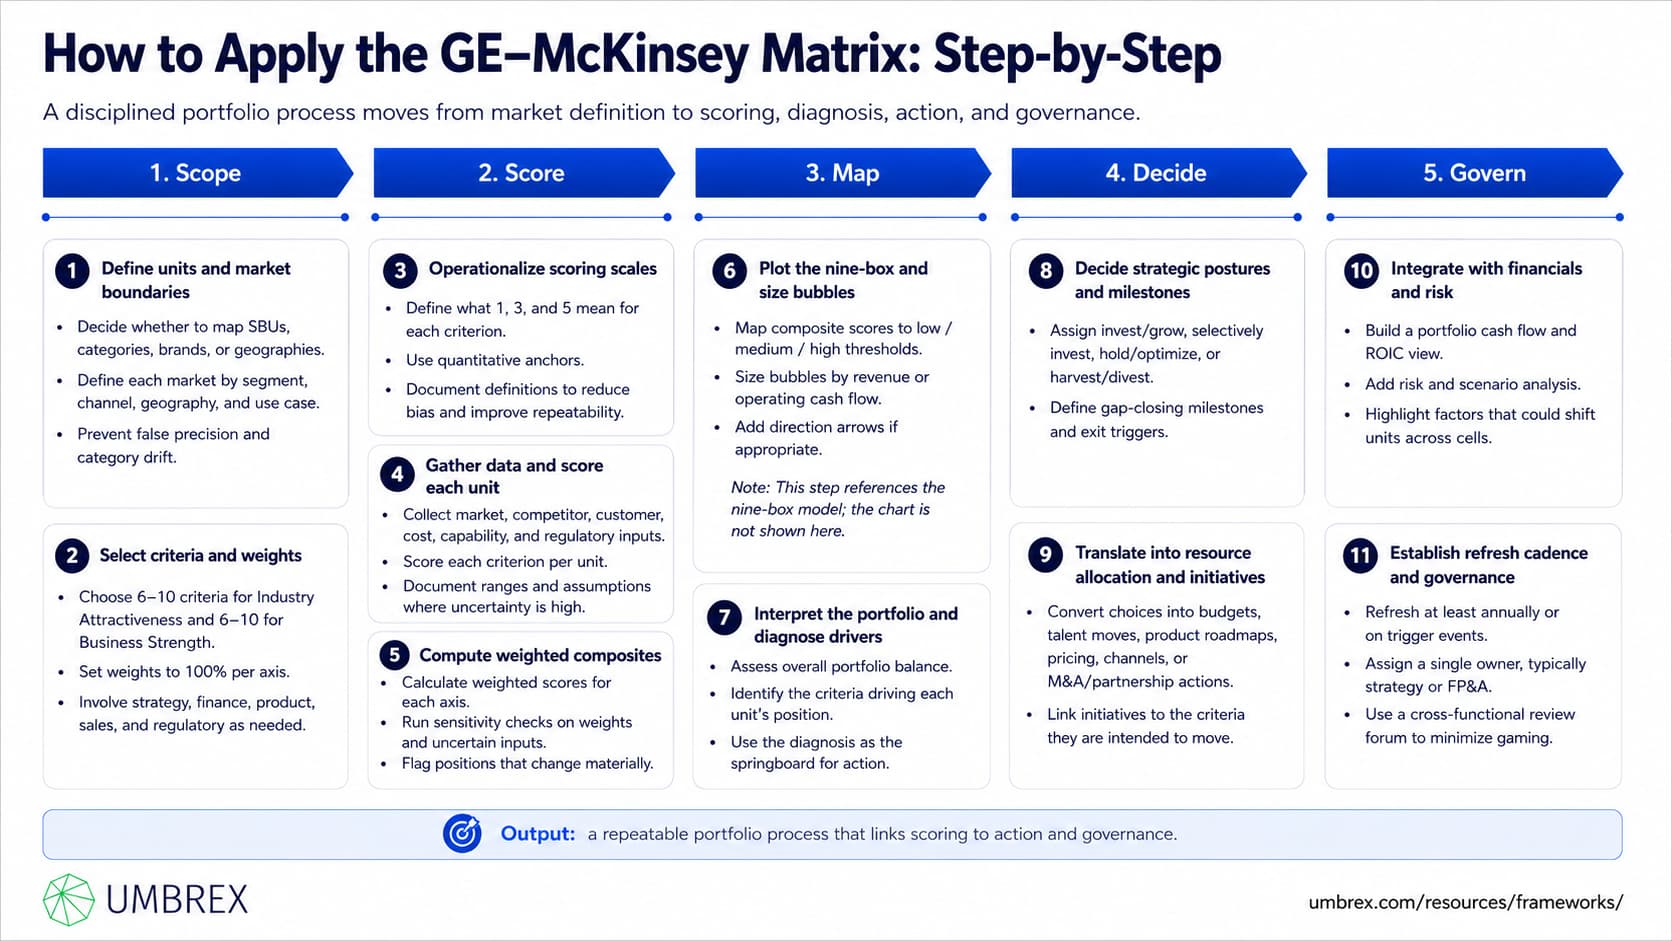
- Define the units of analysis and market boundaries.
Decide whether to map SBUs, categories, brands, or geographies. Precisely define each unit’s market by segment, channel, geography, and use case. Clear boundaries prevent false precision and “category drift.”
- Select criteria for both axes and set weights.
Choose 6–10 criteria for Industry Attractiveness and 6–10 for Business Strength. Assign weights that sum to 100% per axis. Involve strategy, finance, product, sales, and, where relevant, regulatory to ensure completeness and buy-in.
- Operationalize scoring scales.
Define what a 1, 3, and 5 mean for each criterion using quantitative anchors (e.g., “industry ROIC: 1 ≤ WACC, 3 ≈ WACC+2pp, 5 ≥ WACC+5pp”). Document definitions to minimize bias and enable repeatability.
- Gather data and score each unit.
Collect market data (size, growth, structure), competitive benchmarks, customer metrics (NPS, retention), cost and capability metrics, and regulatory outlooks. Score each criterion per unit. Where uncertainty is high, document ranges and assumptions.
- Compute weighted composites and run sensitivity checks.
Calculate the weighted score for each axis. Test sensitivity to weights and uncertain inputs; flag units whose positions change meaningfully under reasonable ranges.
- Plot the nine-box and size bubbles.
Place each unit on the grid using composite scores mapped to low/medium/high thresholds (e.g., 1.0–2.3 = low, 2.4–3.6 = medium, 3.7–5.0 = high). Size bubbles by revenue or operating cash flow; add direction arrows if appropriate.
- Interpret the portfolio and diagnose drivers.
Assess balance (enough “invest” units? too many “harvest” units?). For each unit, identify which criteria drive its position (e.g., strong brand but weak channel access). This diagnosis is the springboard for action.
- Decide strategic postures and milestones by cell.
Assign clear postures (invest/grow, selectively invest, hold/optimize, harvest/divest). For “selectively invest,” define what gaps to close and by when; for “harvest/divest,” set exit triggers.
- Translate intoresource allocation and initiatives.
Convert decisions into budgets, capacity adds, talent moves, product roadmaps, pricing actions, channel investments, or M&A/partnership plays. Link each initiative to the criteria it is intended to move.
- Integrate with financials and risk.
Build a portfolio cash flow view and ROIC expectations. Include risk and scenario analysis (e.g., regulatory outcomes, technology shifts) that could move units across cells.
- Establish a refresh cadence and governance.
Refresh the matrix at least annually or on trigger events (major competitive entry, regulation, platform change). Keep a single owner (strategy/FP&A) and a cross-functional review forum to minimize gaming.
6. Example: The GE–McKinsey Matrix in Action
Context: A $2.4B industrial technology company operates four business lines: Factory Automation (FA), Industrial Sensors (IS), Energy Grid Software (EGS), and Legacy Control Hardware (LCH). Growth is uneven, capital is constrained, and the board seeks a sharper allocation narrative.
Setup: Units of analysis are the four lines in EMEA and North America combined. Time horizon: 3 years. Criteria (weighted) include:
- Industry Attractiveness (weights): market growth (15%), profit pool stability (15%), competitive intensity (15%), adoption of new standards/tech tailwinds (20%), regulatory outlook (10%), buyer power/switching costs (15%), cyclicality (10%).
- Business Strength (weights): relative share and momentum (20%), cost position (15%), differentiation/IP (15%), channel access/partners (15%), product roadmap velocity (15%), service/uptime (10%), talent depth (10%).
Scoring highlights:
- FA: High attractiveness (Industry 4.0 adoption strong; moderate buyer power), strong position (leading share in mid-market, robust partner ecosystem). Composite: Attractiveness 4.1 (High); Strength 3.9 (High).
- IS: Medium attractiveness (fragmented, price pressure), medium strength (good IP but weak distribution). Composite: Attractiveness 3.0 (Medium); Strength 2.8 (Medium).
- EGS: High attractiveness (grid modernization, regulatory funding, long contracts), medium strength (solid product, limited references, need compliance certifications). Composite: Attractiveness 4.3 (High); Strength 3.2 (Medium).
- LCH: Low attractiveness (declining demand, commoditization), high strength (installed base, service contracts). Composite: Attractiveness 2.0 (Low); Strength 3.7 (High).
Matrix positions and decisions:
- FA (High/High): Invest/Grow. Add capacity, expand integration partners, accelerate AI-enabled predictive maintenance module. KPI: +300 bps share gain, 25% ARR mix in three years.
- EGS (High/Medium): Selectively Invest. Close strength gaps: obtain required certifications, hire regulatory-savvy sales, partner with two utilities for lighthouse deployments. Milestone: move to High Strength in 18–24 months or pivot to OEM model.
- IS (Medium/Medium): Manage for Value. Focus on high-margin niche sensors (harsh environments). Improve distribution through two specialized distributors. KPI: +400 bps gross margin, flat opex.
- LCH (Low/High): Milk/Harvest. Maximize cash from the installed base, limit new capex, create migration offers to FA. Explore sale of maintenance book to a specialist if valuation meets threshold. KPI: 10% annual opex reduction while maintaining SLA NPS ≥ 50.
Outcomes (12–18 months): FA grows 18% with improved partner productivity; EGS secures two lighthouse wins and upgrades security certification, moving its Strength score from 3.2 to 3.6; IS margin improves 350 bps via niche focus; LCH cash generation increases 12% as opex falls. The company communicates a crisp capital allocation story anchored in the nine-box: invest to scale FA, selectively build EGS strength, optimize IS, and harvest LCH.
7. Strengths and Limitations
Strengths
- Nuanced and customizable: Multi-factor criteria capture the realities of regulated, complex, or fast-evolving markets better than single proxies.
- Alignment engine: Creates a transparent, evidence-based dialogue across functions and reduces political budgeting.
- Action-oriented: Maps cleanly to investment postures, milestones, and resource allocation decisions.
- Comparable over time: With stable criteria, enables year-over-year tracking of progress and the impact of strategic moves.
Limitations
- Subjectivity risk: Criteria choice, weights, and scoring can reflect bias; without anchors, teams may game the numbers.
- Complexity and effort: Requires more data and debate than simple matrices; can slow decisions if over-engineered.
- False precision: Composite scores can create unwarranted confidence; sensitivity analysis is essential.
- Interdependence blind spots: The matrix treats units independently; synergies, shared platforms, and cannibalization need separate analysis.
- Static snapshot: Without refresh and directional indicators, it misses momentum and inflection points.
8. Common Pitfalls (and How to Avoid Them)
- Misdefining markets and units.
What goes wrong: Overbroad units hide weak spots; overnarrow units exaggerate strength.
How to avoid: Define by buyer, use case, channel, and geography; validate with customer and competitor evidence.
- Too many or overlapping criteria.
What goes wrong: Double-counting (e.g., growth and profit stability both capturing the same effect) inflates scores.
How to avoid: Limit to the vital few; eliminate redundancy; ensure orthogonality where possible.
- Unanchored scoring scales.
What goes wrong: Scores drift across reviewers and cycles; comparability declines.
How to avoid: Define quantitative anchors for 1/3/5; calibrate with cross-functional reviews and examples.
- Politics in weighting.
What goes wrong: Weights reflect internal power, not economics.
How to avoid: Set weights with strategy/finance leadership; document rationale tied to value creation drivers.
- No sensitivity or range analysis.
What goes wrong: Small data errors flip cells; decisions whipsaw.
How to avoid: Show score ranges; highlight units that move cells under reasonable assumptions; decide with guardrails.
- Matrix without money.
What goes wrong: Portfolio looks elegant, but budgets and initiatives don’t change.
How to avoid: Tie each posture to specific funding, milestones, and owners; track capital deployment versus plan.
- Ignoring synergies and spillovers.
What goes wrong: “Harvest” decisions undermine platform scale or cross-sell.
How to avoid: Run a separate synergy map; adjust postures where interdependencies are material.
- Set-and-forget.
What goes wrong: The grid ages; new entrants, regulations, or tech shifts aren’t reflected.
How to avoid: Refresh annually and on trigger events; add direction-of-travel arrows and scenario overlays.
9. How the GE–McKinsey Matrix Relates to Other Frameworks
- BCG Growth–Share Matrix: BCG uses two proxies (growth, relative share) for speed and cash logic. Use BCG for rapid screening; use GE–McKinsey when you need multi-factor nuance, especially in regulated or complex markets.
- Porter’s Five Forces: A foundation for Industry Attractiveness criteria (rivalry, entry barriers, buyer/supplier power, substitutes). Use Five Forces to inform scores and weightings.
- VRIO/Core Competence: Inform Business Strength by testing whether advantages are valuable, rare, inimitable, and organized; identify capabilities that shift units rightward over time.
- Ansoff Product–Market Matrix: After deciding where to invest across units, use Ansoff to decide how to grow within each (penetration, product development, market development, diversification).
- Scenario Planning: Overlay scenarios (e.g., regulation, technology) on the nine-box to stress-test positions and inform direction-of-travel arrows.
- Financial value tools (ROIC, EVA, cash flow): Complement composite scores with hard economics to validate investment cases and avoid value-destructive growth.
10. Key Takeaways
- The GE–McKinsey Matrix maps units on Industry Attractiveness versus Business Unit Strength using weighted, multi-factor criteria.
- It enables rigorous, evidence-based capital allocation—invest/grow where attractiveness and strength align; harvest/divest where they do not.
- The quality of criteria, weights, and scoring discipline determines usefulness; anchor scales and run sensitivity checks.
- Translate cell positions into budgets, initiatives, and milestones; integrate with ROIC and cash flow views.
- Refresh regularly and account for synergies and momentum; the matrix is a decision aid, not a mechanical answer.
11. FAQs About the GE–McKinsey Portfolio Matrix
Is the GE–McKinsey Matrix still relevant today?
Yes. In markets where growth and share alone don’t capture attractiveness or advantage—due to regulation, ecosystems, or capability-driven moats—the nine-box provides needed nuance. Modern practice pairs it with ROIC modeling and scenario analysis.
How do we choose and weight criteria?
Start from value creation drivers in your category: profit pool dynamics for attractiveness; sources of durable advantage for strength. Limit each axis to 6–10 criteria, avoid overlaps, and assign weights that reflect economic importance, not politics. Document anchors for 1/3/5 scoring.
How is it different from the BCG Matrix?
BCG uses two simple proxies (market growth and relative share) and emphasizes cash logic. GE–McKinsey uses customized, weighted criteria for both axes, capturing nuance at the cost of more effort. Use BCG for speed; use GE–McKinsey for multifactor rigor.
Can small or early-stage companies use it?
Yes—lightly. Map your few bet areas (modules, segments) with a handful of criteria. Keep it directional to guide focus without over-engineering. Revisit frequently as data quality improves.
How long does a robust nine-box exercise take?
A directional view can be built in 3–5 weeks. A thorough version with triangulated benchmarks, financial modeling, and governance decisions typically takes 6–10 weeks and is often aligned with annual planning.
Should all criteria be weighted equally?
Not necessarily. Weight by economic significance and differentiation in your category. For example, regulatory barriers may deserve higher weight in healthcare; ecosystem strength might dominate in platform tech. Test sensitivity to ensure conclusions are robust.
