

1. What Is the BCG Growth–Share Matrix?
The BCG Growth–Share Matrix is a classic portfolio analysis tool that helps leaders allocate resources across businesses, product lines, or brands. It positions each unit on a 2×2 based on two variables: market growth rate (a proxy for market attractiveness) and relative market share (a proxy for competitive advantage). The four quadrants—Stars, Cash Cows, Question Marks, and Dogs—suggest different investment postures.
In plain terms: fast-growing markets usually demand cash to fund expansion; high relative share tends to confer cost or scale advantages and thus generate cash. The matrix guides leaders to invest in promising “Stars” and select “Question Marks,” milk “Cash Cows” to fund growth, and harvest or exit “Dogs.”
This is a foundational market and portfolio framework. It is commonly used by consultants and executives in annual planning, corporate strategy, portfolio reviews, and investor communications to create a shared language about growth, risk, and capital allocation.
2. Origin and Background
Origin: Developed by the Boston Consulting Group (BCG) in the late 1960s and early 1970s and popularized by BCG founder Bruce D. Henderson through BCG Perspectives, notably “The Product Portfolio” (circa 1970).
The matrix arose from two linked ideas: (1) the experience curve (costs decline with cumulative volume, favoring high-share players), and (2) cash flow patterns by market maturity (high-growth markets consume cash; mature markets generate it). Managers needed a simple way to see where each business stood and to balance cash generators with cash consumers.
It became widely known via consulting practice, business school curricula, and corporate planning in the 1970s and 1980s, and remains a staple—often augmented with additional metrics—because it forces explicit trade-offs.
3. How the BCG Growth–Share Matrix Works
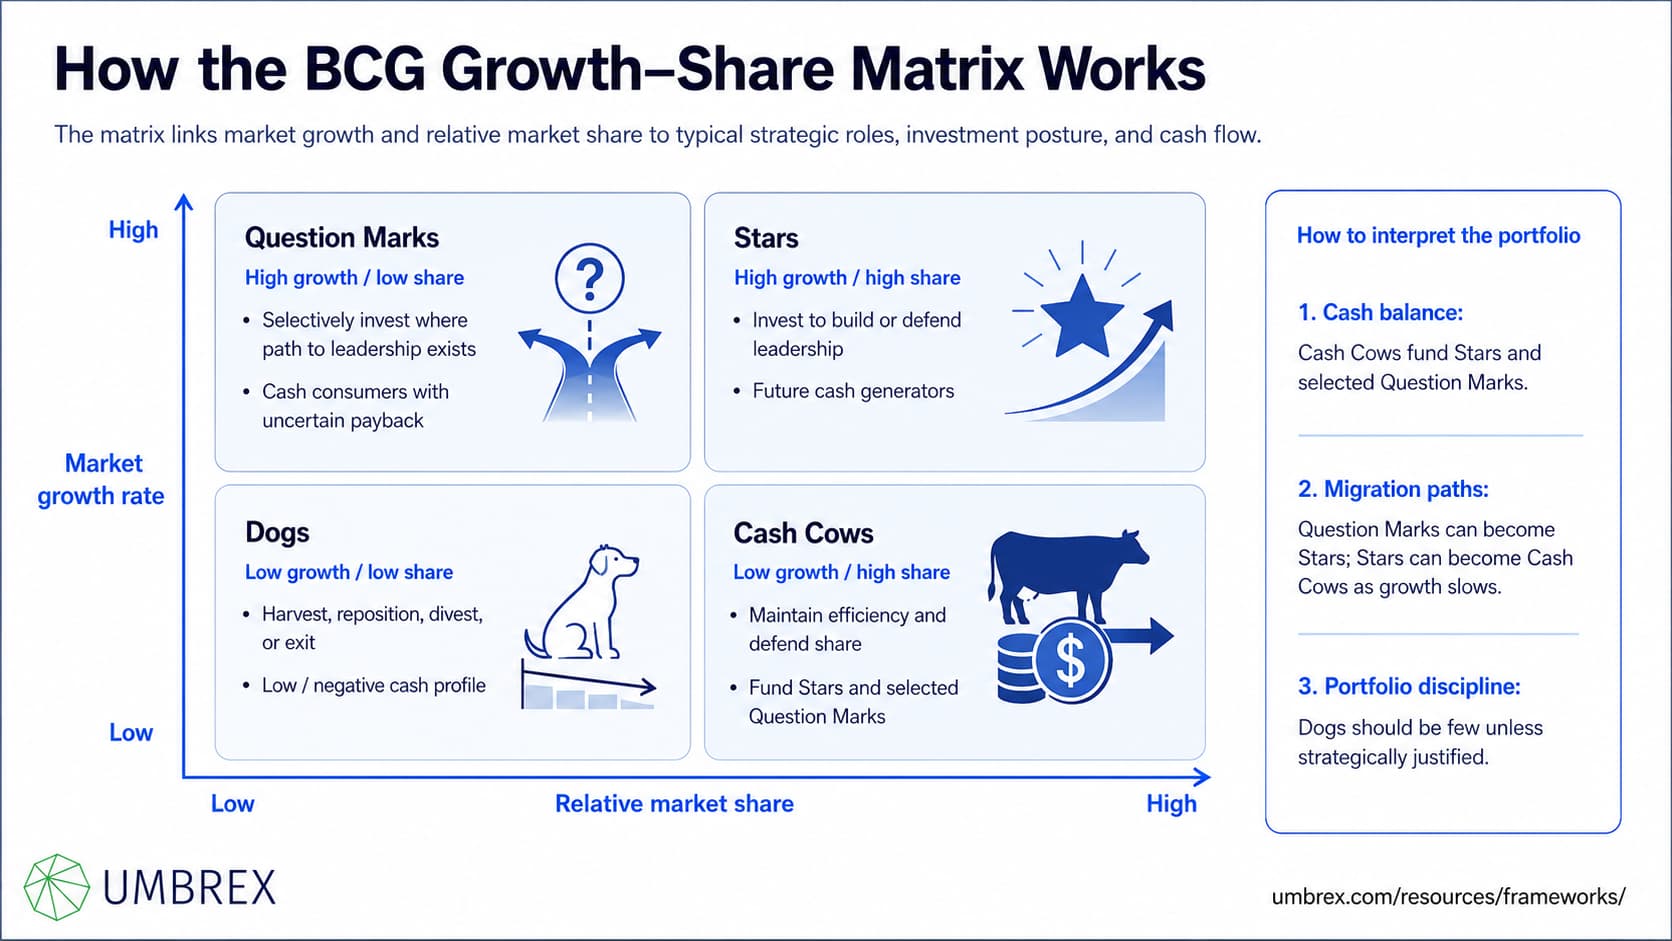
The matrix crosses market growth (high/low) with relative market share (high/low). Each quadrant implies a typical strategic role and cash flow profile.
The axes
- Market growth rate: Annual growth of the market in which the unit competes. Higher growth signals potential but typically requires investment (capacity, sales, working capital).
- Relative market share: Your share relative to the largest competitor. It proxies competitive advantage through scale and the experience effect. A common calculation is:
Relative Market Share = (Your Share) / (Share of Largest Competitor)
Values above 1.0 imply leadership; below 1.0 imply a follower position. Plotting on a log scale is common to reflect nonlinear advantages of share.
The four quadrants
- Stars (High growth, High share)
Leaders in fast-growing markets. They typically require heavy investment to maintain share as the category expands but can become the next generation of Cash Cows when growth slows.
- Posture: Invest to build/defend leadership; focus on capacity, innovation, and go‑to‑market scale.
- Cash profile: Often near break-even on cash while growing; large future cash generators.
- Cash Cows (Low growth, High share)
Leaders in mature markets. With slower growth and scale advantages, they generate excess cash.
- Posture: Maintain efficiency and defend share; avoid overinvestment; harvest cash to fund Stars/Question Marks.
- Cash profile: Positive free cash flow; fund the portfolio.
- Question Marks (High growth, Low share)
Challengers in attractive markets. They demand cash to grow but may never achieve leadership if barriers are high or rivals respond aggressively.
- Posture: Selectively invest where a credible path to leadership exists; otherwise, prune or partner.
- Cash profile: Significant cash consumers with uncertain payback.
- Dogs (Low growth, Low share)
Niche or declining positions. They rarely generate attractive returns absent strategic synergies.
- Posture: Harvest for cash, reposition to a defendable niche, or divest/exit.
- Cash profile: Low or negative; tie up management attention.
Interpreting the matrix
- Bubble size: Often represents revenue or profit to show business weight.
- Cash balance logic: A healthy portfolio mixes Cash Cows (funding) with Stars and selected Question Marks (consuming). Dogs should be few unless they serve a strategic purpose.
- Dynamics: Units can migrate: Question Marks → Stars (if they win share), Stars → Cash Cows (as growth slows), Cash Cows → Dogs (if share erodes), Dogs → Exit.
4. When to Use the BCG Growth–Share Matrix
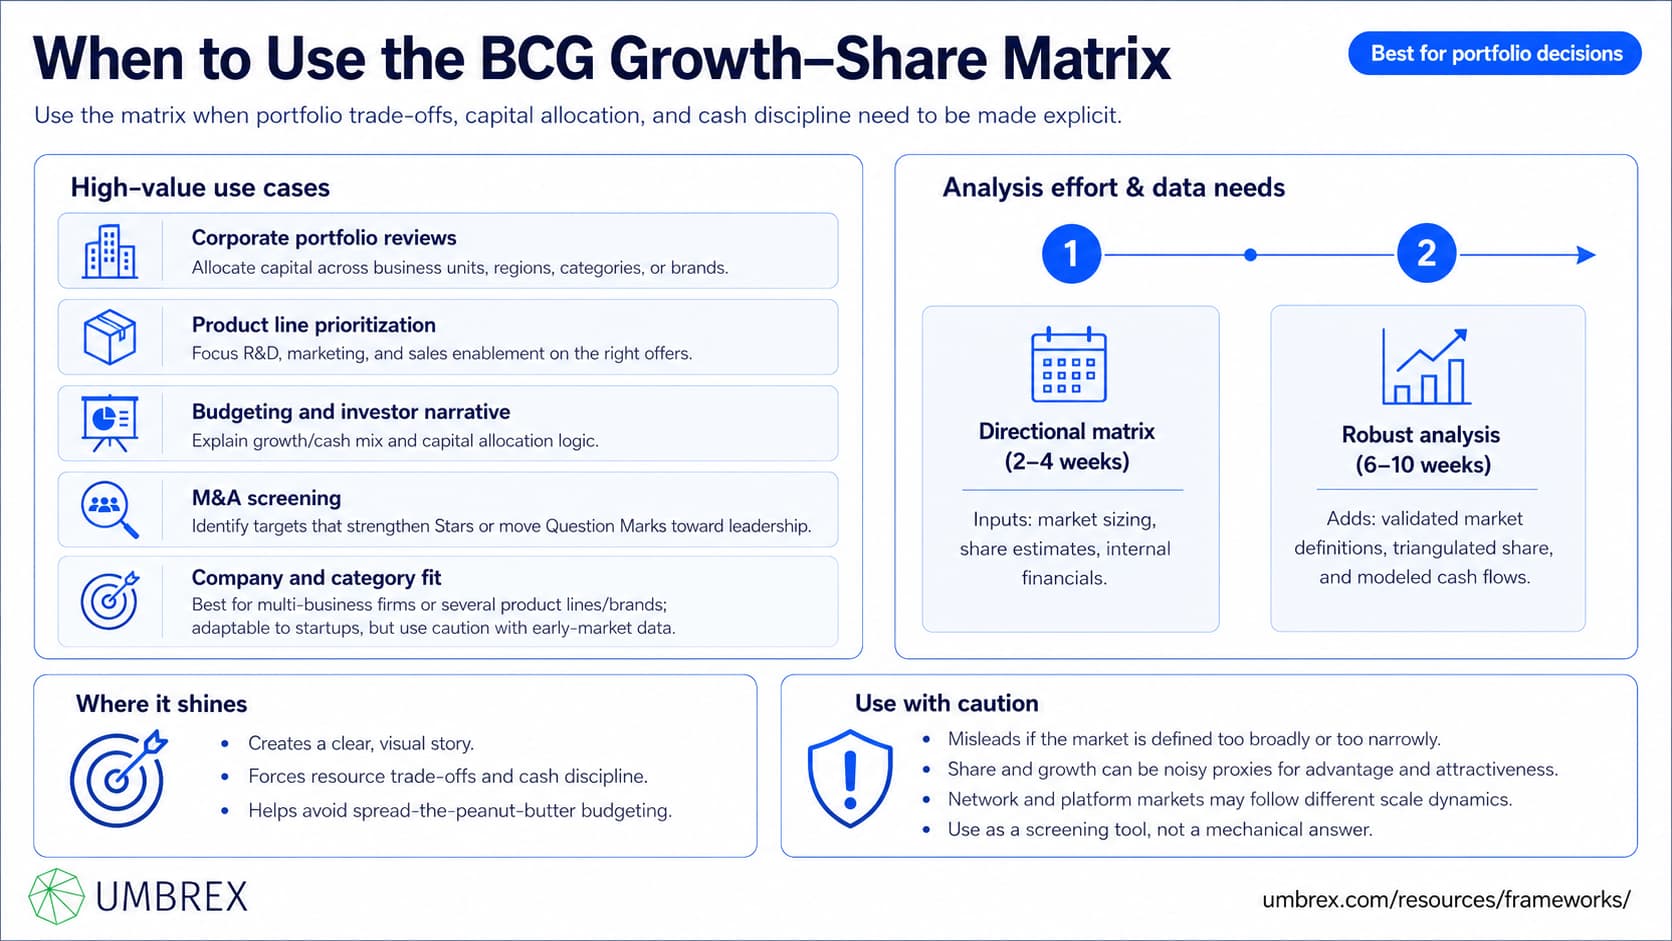
High-value use cases:
- Corporate portfolio reviews: Allocate capital across business units, regions, categories, or brands.
- Product line prioritization: Focus R&D, marketing, and sales enablement on the right offers.
- Budgeting and investor narrative: Explain growth/cash mix and capital allocation logic.
- M&A screening: Identify targets that accelerate Stars or upgrade Question Marks to leadership.
Company and category fit: Most applicable to multi-business enterprises or firms with several distinct product lines or brands. It can be adapted for startups with multiple modules or bet areas, but be cautious about data quality and the volatility of early markets.
Data/time requirements: A directional matrix can be prepared in 2–4 weeks with market sizing, share estimates, and internal financials. A robust analysis—validating definitions, triangulating share, modeling cash flows—typically takes 6–10 weeks.
Where it shines: Creating a clear, visual story that forces resource trade-offs and a cash discipline; avoiding “spread-the-peanut-butter” budgets.
Where it can mislead: When “market” is defined too broadly or narrowly; when share and growth are noisy proxies for advantage and attractiveness; or in network/platform markets where scale dynamics differ. Use it as a screening tool, not a mechanical answer.
5. How to Apply the BCG Growth–Share Matrix: Step-by-Step
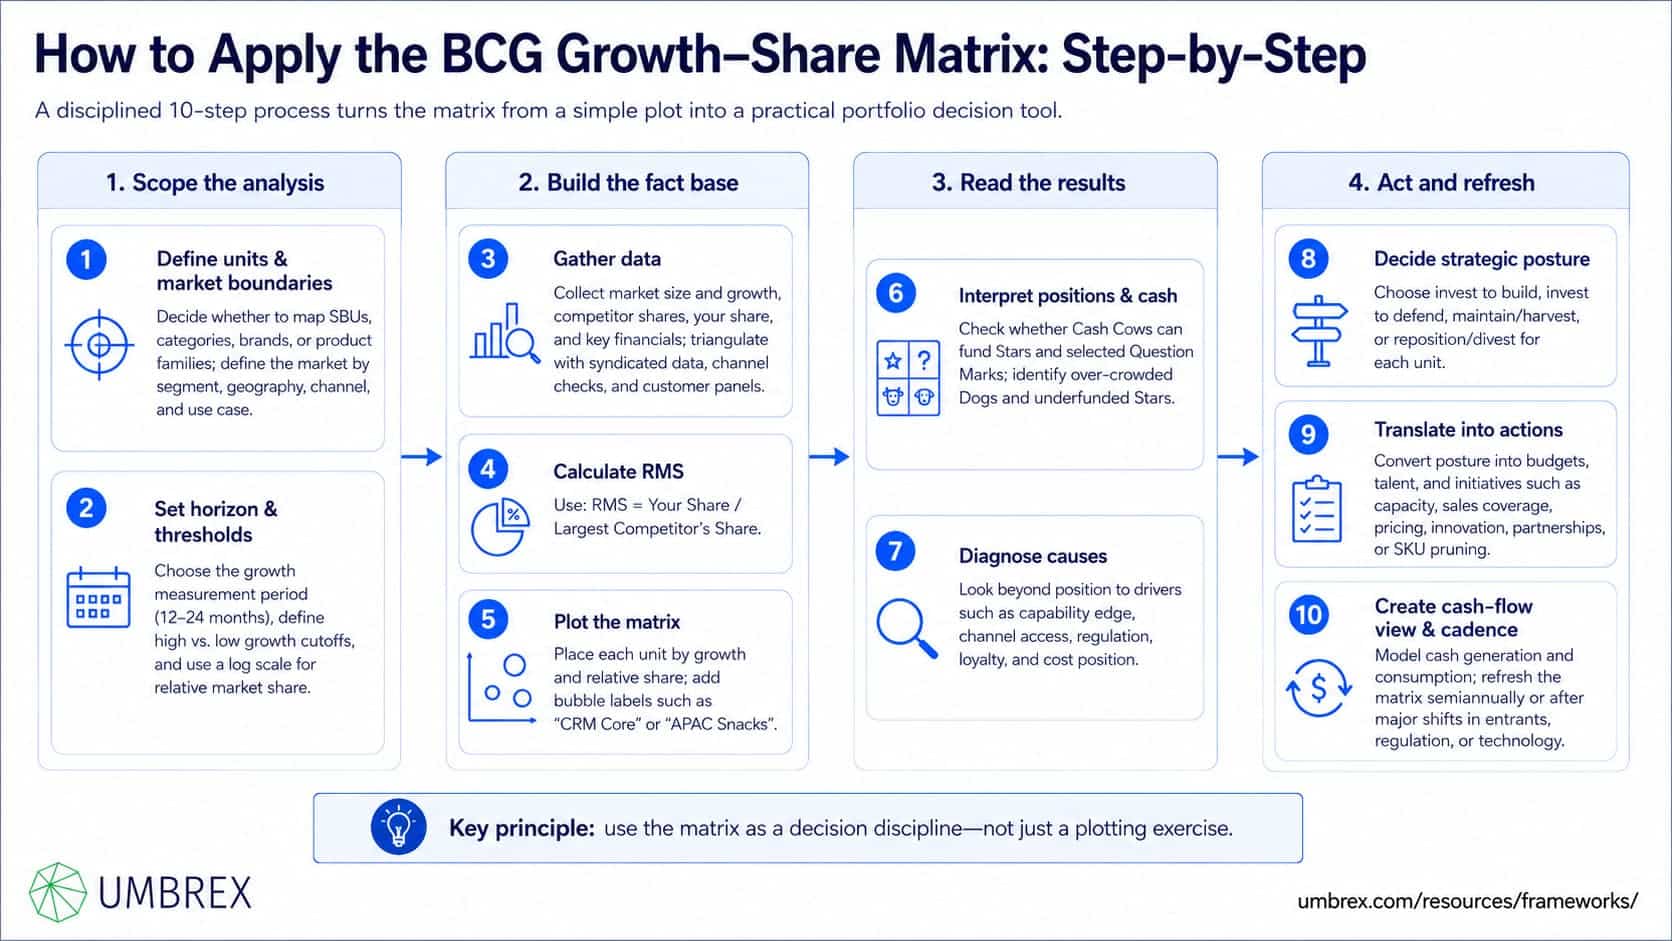
- Define the units of analysis and the market boundaries.
Decide whether to map SBUs, categories, brands, or product families. Precisely define each unit’s “market”—by segment, geography, channel, and use case. Misdefinition is the root of most errors.
- Set the time horizon and thresholds.
Choose the period for growth measurement (e.g., 12–24 months). Define cutoffs for “high” vs. “low” growth using category norms. Use a log scale for relative market share to reflect nonlinear effects of scale.
- Gather data.
Collect market size and growth, competitor shares (unit or revenue, as appropriate), your unit’s share, and basic financials (revenue, gross margin, operating cash flow, required capex/working capital). Triangulate shares via syndicated data, channel checks, and customer panels.
- Calculate relative market share.
For each unit, compute share versus the largest rival: RMS = Your Share / Largest Competitor’s Share. For multi-region or multi-channel units, compute at the relevant level and weight appropriately.
- Plot the matrix and size the bubbles.
Place each unit at the intersection of its growth rate and relative share. Size bubbles by revenue or operating cash flow. Add labels (e.g., “CRM Core,” “APAC Snacks”).
- Interpret positions and cash implications.
Assess whether Cash Cows are sufficient to fund Stars/Question Marks. Identify over-crowded Dogs, underfunded Stars, and ambiguous Question Marks. Note any units straddling cutoffs—test sensitivity to data uncertainty.
- Diagnose causes, not just positions.
Ask why each unit sits where it does: capability edge, channel access, regulatory barriers, loyalty, cost position. Relative share is a symptom; the capability system is the cause.
- Decide strategic posture by unit.
For each unit, choose one: invest to build (Question Mark → Star), invest to defend (Star), maintain/harvest (Cash Cow), reposition/harvest/divest (Dog). Document the “why,” milestones, and exit triggers.
- Translate into resource allocation and initiatives.
Convert posture into budgets, talent, and initiatives: capacity adds, sales coverage, pricing, innovation, channel partnerships, or pruning SKUs. Avoid starving Stars to protect Dog vanity projects.
- Create a portfolio cash flow view and refresh cadence.
Model cash generation/consumption by unit. Ensure a self-funding path or a clear financing plan. Refresh the matrix semiannually or when major shifts (new entrants, regulation, technology) occur.
6. Example: The BCG Matrix in Action
Context: A $1.5B enterprise software company offers a suite across four major modules: CRM Core, Workflow Automation, Analytics AI, and Legacy On‑Prem Support. Growth has slowed and profitability is uneven. The board seeks a clearer capital allocation plan.
BCG mapping:
- CRM Core: Market growth 6% (mature), relative share 1.6 (category leader). Strong free cash flow. → Cash Cow.
- Workflow Automation (cloud): Market growth 22%, relative share 1.2 in mid‑market. High NRR, strong pipeline. Significant investment needs. → Star.
- Analytics AI add‑on: Market growth 30%+, relative share 0.4 (several larger incumbents). Early traction in healthcare. Heavy GPU costs and model ops complexity. → Question Mark.
- Legacy On‑Prem Support: Market growth −5%, relative share 0.6. Declining base with high support costs. → Dog.
Decisions and actions:
- Invest to defend the Star: Increase quota-carrying capacity for Workflow Automation in EMEA; expand partner integrations; accelerate roadmap for compliance features demanded in regulated industries.
- Selectively bet on the Question Mark: Narrow focus of Analytics AI to two verticals (healthcare and financial services) where the firm has data partnerships; establish target share milestones (≥0.8 RMS in 18 months) and GPU cost guardrails. If milestones miss, pivot to OEM model.
- Milk the Cash Cow: Hold CRM Core R&D to sustaining innovation, optimize pricing and discounting, and shift a portion of marketing to cross-sell Stars and Question Marks into the base. Target flat opex with modest growth.
- Harvest/exit the Dog: Create a 24‑month wind‑down plan for Legacy On‑Prem Support; migrate customers via incentives to cloud modules; outsource tier‑1 support to reduce fixed costs. Explore sale of the maintenance contracts to a specialist provider.
Outcomes (12–18 months): Workflow Automation ARR grows 34% with improving payback; Analytics AI achieves 0.7 RMS in healthcare and meets cost thresholds; CRM Core expands gross margin by 300 bps and funds 75% of growth investments; On‑Prem Support costs drop 40% with 55% of customers migrated. The company communicates a crisp portfolio narrative: fund the core cow, scale the star, make a focused bet on one question mark, and exit the dog.
7. Strengths and Limitations
Strengths
- Clarity and focus: A one‑page view that forces trade-offs and aligns executives on where to invest and where to prune.
- Cash discipline: Links strategy to funding needs and sources; prevents diffuse, underfunded bets.
- Dynamic portfolio logic: Anticipates migration of units across quadrants over time; encourages staging.
- Communication power: Easy to explain to boards and investors; provides a shared language across functions.
Limitations
- Proxy variables: Growth ≠ attractiveness in all cases; share ≠ advantage if economics are poor or network effects dominate differently.
- Static snapshot: Ignores how quickly capabilities and competitor moves can reshape positions.
- Simplification risk: Reduces multifactor reality (e.g., regulation, switching costs, synergies) to two dimensions.
- Unit definition sensitivity: Results are highly sensitive to how markets and units are defined.
- Platform and ecosystem nuance: In multi-sided markets, “share” and “growth” across sides can’t be captured in a single point.
8. Common Pitfalls (and How to Avoid Them)
- Misdefining the market.
What goes wrong: Overbroad markets inflate growth and hide true rivals; overnarrow markets exaggerate share.
How to avoid: Define by buyer segment, use case, geography, and channel; validate with customer and competitor evidence.
- Using absolute, not relative, share.
What goes wrong: Overstates leadership and experience-curve effects.
How to avoid: Always compute share versus the largest competitor; use a log scale for plotting.
- Treating the matrix as a formula.
What goes wrong: Mechanical “invest/harvest” calls ignore unit economics, synergies, or strategic options.
How to avoid: Pair the matrix with economics (ROIC, cash flow), capability assessments, and competitive strategy.
- Starving Stars to protect Dogs.
What goes wrong: Underfunded Stars cede leadership; Dogs consume management time for little return.
How to avoid: Set capital guardrails that prioritize Stars and selected Question Marks; enforce exit triggers for Dogs.
- Ignoring migration logic.
What goes wrong: Today’s Stars aren’t readied to become tomorrow’s Cows; Question Marks linger indefinitely.
How to avoid: Define milestones and timing for migration; redirect funding as growth slows or milestones hit/miss.
- Confusing revenue with profit bubble size.
What goes wrong: Big bubbles bias attention even if margins are weak.
How to avoid: Size by operating cash flow or add labels showing margin and capital intensity.
- One-and-done analysis.
What goes wrong: The picture ages quickly; decisions drift.
How to avoid: Refresh semiannually and on trigger events (major entry, regulation, platform shifts).
9. How the BCG Matrix Relates to Other Frameworks
- GE–McKinsey 9‑Box: Uses multi-factor “industry attractiveness” and “business strength” instead of single proxies (growth/share). Choose 9‑Box when you need a richer, criteria-weighted view; use BCG for speed and cash logic.
- Ansoff Product–Market Matrix: After you decide where to invest (BCG), use Ansoff to decide how to grow each unit (penetration, market development, product development, diversification).
- Porter’s Five Forces: Explains underlying industry structure and profit pools that growth rates can hide; use to validate attractiveness assumptions.
- Experience Curve: The economic rationale behind relative share advantages; apply to confirm cost-learning benefits actually exist in your category.
- VRIO and Core Competence: Assess whether your high-share positions are rooted in advantages that are valuable, rare, inimitable, and organized; informs durability of Stars/Cows.
- Financial value tools (ROIC, EVA): Complement the matrix with rigorous economics to avoid investing in growth that destroys value.
10. Key Takeaways
- The BCG Growth–Share Matrix maps units by market growth and relative share into Stars, Cash Cows, Question Marks, and Dogs to guide capital allocation.
- Its power lies in cash logic: Cows fund Stars and select Question Marks; Dogs are harvested or exited unless strategically essential.
- Define markets precisely and use relative share (often on a log scale); otherwise the picture misleads.
- Use the matrix as a screening and alignment tool, complemented by economics, capability assessments, and competitive analysis.
- Refresh regularly and plan for migration across quadrants; avoid starving Stars or subsidizing Dogs indefinitely.
11. FAQs About the BCG Growth–Share Matrix
Is the BCG Matrix still relevant today?
Yes—as a fast, visual screening tool for portfolio discussions and cash allocation. Modern practice augments it with multi‑factor assessments (e.g., GE–McKinsey 9‑Box), ROIC and cash flow modeling, and capability/competitive analysis to avoid proxy pitfalls.
How is BCG different from the GE–McKinsey 9‑Box?
BCG uses two simple proxies (growth and relative share) to drive a cash-based narrative. GE–McKinsey scores “industry attractiveness” and “business strength” on multiple weighted criteria, providing nuance. Use BCG for speed and storytelling; use 9‑Box for complex, multi-criteria decisions.
How do I calculate relative market share?
Divide your unit’s market share by the share of the largest competitor in the defined market: RMS = Your Share / Largest Rival’s Share. Use comparable measures (units vs. units, revenue vs. revenue) and a log scale for plotting to reflect nonlinear scale advantages.
Can small or early-stage companies use the BCG Matrix?
Yes, but carefully. Early markets are volatile and shares shift quickly. Use the matrix to frame bets across modules or use cases, then rely on customer evidence, unit economics, and milestones rather than quadrant labels to make go/no‑go calls.
How long does a robust BCG exercise take?
A directional view in 2–4 weeks with desk research and internal data; a full refresh with triangulated shares, financial modeling, and governance decisions typically takes 6–10 weeks, often aligned to annual planning.
