
Goal of the analysis:
The goal of an In-store Sampling and Shopper Activation Effectiveness analysis in the consumer packaged goods (CPG) industry is to evaluate the impact of in-store product sampling and shopper activation activities (e.g., demonstrations, product giveaways, interactive experiences) on sales, brand awareness, and consumer engagement. This analysis helps CPG companies understand how effectively these tactics drive immediate purchases, build long-term brand loyalty, and influence shopper behavior. By assessing the return on investment (ROI) of in-store sampling and activations, companies can optimize their marketing strategies and improve the effectiveness of their shopper engagement efforts.
Data required:
- Sales data before, during, and after in-store sampling events
- Sampling costs (e.g., product, staff, materials, setup costs)
- Consumer engagement metrics (e.g., number of samples distributed, consumer interactions)
- Redemption rates for any associated promotions (e.g., coupons, discounts offered during sampling)
- Shopper conversion rates (e.g., percentage of shoppers who purchased after sampling)
- Feedback from in-store staff or brand ambassadors regarding consumer reactions
- Competitor sampling or activation activities during the same period
- Shopper demographics and purchase behavior data (e.g., first-time buyers, brand switchers)
- Product stock levels during sampling events (to avoid stockouts)
- Consumer feedback surveys or post-event follow-up data
Detailed step-by-step instruction on how to conduct the analysis:
1. Define the objectives of the in-store sampling and shopper activation.
Clearly outline the goals of the sampling or shopper activation campaign. These might include increasing immediate sales, raising brand awareness, encouraging trial of a new product, or driving long-term consumer loyalty.
For example, the objective could be to increase sales by 20% during the activation period or to introduce a new product to 1,000 consumers.
2. Collect sales data before, during, and after the sampling event.
Gather sales data for the period before the sampling event (to establish a baseline), during the event, and after it concludes. This will allow you to measure the impact of the activation on sales and see whether the sales increase persists after the event.
The formula for sales uplift is:
Sales Uplift (%) = ((Sales During Event – Baseline Sales) / Baseline Sales) x 100
For example, if baseline sales were $10,000 and sales during the sampling event increased to $15,000:
Sales Uplift = (($15,000 – $10,000) / $10,000) x 100 = 50%
3. Track sampling and engagement metrics.
Record the number of samples distributed and the number of shopper interactions during the event. These engagement metrics will help assess how many consumers were reached by the activation.
You can also track additional engagement data, such as the number of social media mentions or the number of shoppers who participated in interactive experiences (e.g., contests, product demonstrations).
4. Calculate shopper conversion rates.
Measure the percentage of shoppers who purchased the product after receiving a sample.
The formula for shopper conversion rate is:
Shopper Conversion Rate (%) = (Number of Shoppers Who Purchased After Sampling / Total Number of Shoppers Who Sampled) x 100
For example, if 1,000 shoppers sampled the product and 300 made a purchase:
Shopper Conversion Rate = (300 / 1,000) x 100 = 30%
A higher conversion rate indicates that the sampling activation effectively encouraged trial and immediate purchase.
5. Evaluate redemption rates for promotional offers.
If coupons or discounts were offered as part of the in-store activation, track the redemption rates to understand how many shoppers took advantage of the promotion.
The coupon redemption rate can be calculated as:
Redemption Rate (%) = (Number of Coupons Redeemed / Number of Coupons Distributed) x 100
For example, if 500 coupons were distributed and 50 were redeemed:
Redemption Rate = (50 / 500) x 100 = 10%
6. Analyze the impact on long-term consumer behavior.
Beyond immediate sales, assess how the sampling event influenced long-term consumer behavior. Track repeat purchases, new customer acquisition, and brand switching. If possible, use loyalty programs or point-of-sale data to see if shoppers who sampled the product became repeat customers. Additionally, review any follow-up surveys or feedback to gauge consumer satisfaction.
7. Review competitor sampling and activation efforts.
Analyze whether competitors were conducting similar in-store sampling or shopper activation activities during the same period. If competitors had higher engagement or more prominent in-store activations, it may explain differences in sales performance. Comparing your activation with competitors can provide insights into how to improve future efforts.
8. Gather feedback from in-store staff and brand ambassadors.
Collect qualitative feedback from the staff or brand ambassadors who managed the in-store activation. This can provide valuable insights into consumer reactions, common questions or objections, and overall enthusiasm for the product. Understanding how shoppers responded to the activation can inform improvements for future events.
9. Monitor stock levels during the sampling event.
Ensure that there is sufficient stock of the product being sampled to meet increased demand. If stockouts occur during or after the event, it may limit the effectiveness of the activation and result in missed sales opportunities. Track stock levels and adjust replenishment schedules to ensure product availability.
10. Measure the return on investment (ROI) of the sampling event.
Calculate the ROI of the sampling and shopper activation event to assess whether the investment generated enough incremental sales to justify the costs.
The formula for sampling ROI is:
ROI (%) = ((Incremental Sales – Sampling Costs) / Sampling Costs) x 100
For example, if incremental sales were $10,000 and sampling costs (including product, staff, and setup) were $2,000:
ROI = (($10,000 – $2,000) / $2,000) x 100 = 400%
Format of the output of analysis:
The output of an In-store Sampling and Shopper Activation Effectiveness analysis typically includes:
- Sales performance data before, during, and after the sampling event, including sales uplift calculations.
- Conversion rate analysis showing the percentage of shoppers who purchased after sampling.
- Engagement metrics, including the number of samples distributed and shopper interactions.
- Redemption rates for any promotional offers (e.g., coupons, discounts).
- Insights into long-term consumer behavior, including repeat purchases and brand switching.
- Competitor benchmarking data, highlighting differences in activation strategies.
- Qualitative feedback from in-store staff or brand ambassadors.
- Recommendations for optimizing future sampling and shopper activation events.
- Return on investment (ROI) analysis showing the financial impact of the activation.
How to interpret results:
- High conversion rates with strong sales uplift: Indicates that the sampling or activation event effectively drove immediate purchases and positively influenced shopper behavior. Consider replicating similar events in other stores or regions to maximize the impact.
- High engagement but low conversion rates: If the event reached many shoppers but did not result in a high percentage of purchases, this may indicate that the product itself or the sampling experience was not compelling enough to convert trial into purchase. Review the quality of the samples, the promotional offer, or the in-store presentation.
- Strong sales during the event but limited long-term impact: If sales spiked during the sampling event but did not result in repeat purchases, this may indicate that consumers were motivated by the novelty of the event but did not develop brand loyalty. Consider implementing follow-up engagement strategies (e.g., loyalty programs or targeted offers) to retain these new customers.
- Low sales uplift despite competitive sampling efforts: If competitors achieved better results from their sampling activations, assess what differentiated their strategy. Factors such as product placement, sample size, or promotional support could be the reason for the disparity.
Steps a company can take to improve on this measure:
- Enhance the shopper experience: Improve the overall sampling and activation experience by ensuring brand ambassadors are well-trained, the sampling station is visually appealing, and consumers receive adequate product information. Interactive elements, such as contests or giveaways, can further engage shoppers.
- Target high-potential shopper segments: Use demographic and shopper data to target in-store sampling efforts to stores with a higher concentration of your target audience. This increases the likelihood of conversion and long-term customer acquisition.
- Optimize promotional offers: Pair sampling with compelling promotional offers (e.g., coupons or buy-one-get-one-free deals) to encourage immediate purchase. Track the redemption rates and adjust future offers based on shopper preferences.
- Ensure product availability: Avoid stockouts during sampling events by coordinating with retailers to ensure that adequate stock is available. This ensures that shoppers who want to purchase the product can do so immediately.
- Measure and iterate: Continuously track and analyze the performance of in-store sampling and shopper activation efforts. Use data-driven insights to optimize future events, adjusting variables such as sample size, promotional support, or store selection to improve effectiveness.
Request the PDF Download of How to Analyze a Consumer Packaged Goods Company
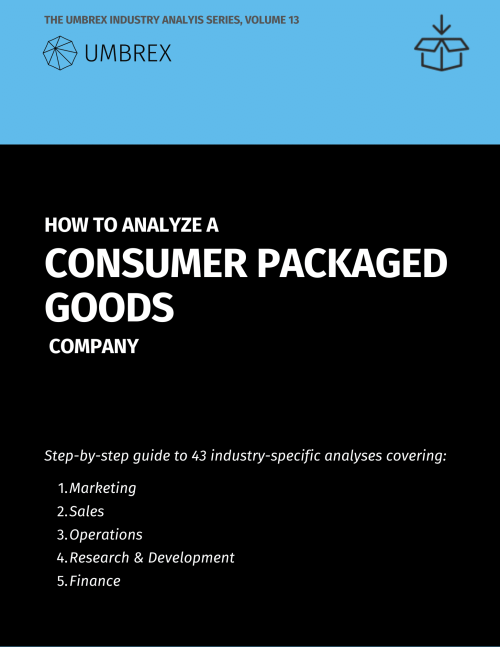
Menu of the 43 analyses:
A. MARKETING
- Brand Portfolio Analysis
- Consumer Behavior and Segmentation Analysis
- Consumer Loyalty and Retention Analysis
- Marketing Mix Effectiveness (4Ps)
- Ethnic and Multicultural Consumer Segment Analysis
- Product Reformulation and Ingredient Cost Trade-off Analysis
- Consumer Advocacy and Brand Perception Tracking
- Shopper Marketing and Path-to-Purchase Insights
- Consumer Sentiment and Social Listening Analysis
- Consumer Demand Shaping through Marketing Campaigns
B. SALES
- Channel Strategy Assessment
- Direct-to-Consumer Channel Performance
- Promotional Pricing and Discount Depth Analysis
- Retailer Relationship and Negotiation Power Assessment
- Retailer-Specific Marketing and Joint Business Planning
- Trade Promotion Effectiveness
- Shelf Availability and Out-of-Stock Analysis
- In-store Execution and Merchandising Compliance Analysis
- Category Management and Shelf Space Optimization
- In-store Sampling and Shopper Activation Effectiveness
- Price-Pack Architecture Optimization
- Private Label Cannibalization and Erosion Impact
C. OPERATIONS
- Product Mix and SKU Rationalization
- Supply Chain Efficiency and Distribution Network Analysis
- Co-packing and Contract Manufacturing Evaluation
- Sourcing and Raw Material Cost Analysis
- Regional and Local Market Penetration Analysis
- Perishability and Freshness Management in Supply Chain
- End-to-End Product Traceability and Transparency Analysis
- Inventory Turns and Shelf-Life Optimization
- Distributor and Wholesaler Performance Analysis
- Distributor Margin and Channel Conflict Assessment
- Product Recall and Quality Control Analysis
D. RESEARCH & DEVELOPMENT
- Innovation Pipeline and New Product Development (NPD) Analysis
- Product Cannibalization and Cross-Selling Impact
- Product Lifecycle Management (PLM)
- Packaging and Labeling Regulatory Compliance
- Health and Wellness Trends Impact on Product Portfolio
- Global Sourcing Strategy for Commoditized Ingredients
- Sustainability and Packaging Innovation Analysis
- Brand Dilution and Extension Risk Analysis
E. FINANCE
- Trade Spend Optimization and Return on Investment (ROI)
- Product Line Profitability by Retailer Analysis