
Goal of the analysis:
The goal of a Category Management and Shelf Space Optimization analysis in the consumer packaged goods (CPG) industry is to ensure that product categories are effectively managed to maximize sales, profitability, and customer satisfaction. This analysis focuses on optimizing the allocation of shelf space for products within a category to improve product visibility, meet consumer demand, and enhance the overall shopping experience. By aligning product offerings with consumer behavior and retailer priorities, companies can increase their category leadership, strengthen relationships with retail partners, and drive category growth.
Data required:
- Sales data by product, category, and store
- Profit margin data by product and category
- Market share data for each product within the category
- Shelf space allocation and planogram data (e.g., number of facings, placement location)
- Consumer purchase behavior data (e.g., purchase frequency, basket size, brand switching)
- Category growth trends and consumer demand patterns
- Competitor shelf space allocation and category performance
- Promotional impact data (e.g., sales uplift during promotions, impact of special displays)
- Retailer-specific goals and strategies for category growth
- In-store audit data (e.g., compliance with planograms, display effectiveness)
Detailed step-by-step instruction on how to conduct the analysis:
1. Define the objectives of the analysis.
Set clear goals for category management and shelf space optimization. These objectives may include increasing category sales, improving product visibility, enhancing profitability, and aligning with retailer-specific strategies. For example, a goal could be to optimize shelf space to reflect the highest-performing products or to introduce new products in response to consumer demand.
2. Analyze category sales and profitability.
Collect sales data for all products within the category and calculate the profitability of each product. Determine which products generate the highest sales and margins, and which ones underperform. This data will help guide shelf space decisions, ensuring that high-performing products receive adequate visibility.
The formula for profit margin is:
Profit Margin (%) = ((Revenue – Cost of Goods Sold) / Revenue) x 100
For example, if a product generates $100,000 in revenue with a cost of goods sold (COGS) of $60,000:
Profit Margin = (($100,000 – $60,000) / $100,000) x 100 = 40%
3. Evaluate market share by product.
Assess the market share of each product within the category to understand its competitive position. Products with higher market share and strong consumer demand should typically be allocated more shelf space.
Calculate market share using the formula:
Market Share (%) = (Product Sales / Total Category Sales) x 100
For example, if a product has $50,000 in sales within a category that generates $200,000 in total sales:
Market Share = ($50,000 / $200,000) x 100 = 25%
4. Optimize shelf space allocation.
Use sales and market share data to optimize shelf space allocation for each product in the category. High-performing products should receive more facings and be placed in more prominent locations (e.g., eye-level shelves), while underperforming products may require less space or repositioning. Shelf space optimization should consider factors such as:
- Facings: The number of product facings allocated to each SKU.
- Placement: The product’s location on the shelf (e.g., eye-level, lower shelf, endcap).
- Planogram compliance: Ensure that planograms reflect the optimal allocation of shelf space based on performance.
5. Analyze consumer purchase behavior.
Review consumer behavior data, such as purchase frequency, basket size, and brand switching, to guide shelf space decisions. Products that drive high purchase frequency or encourage larger basket sizes may warrant more shelf space.
In addition, if consumers frequently switch between brands, ensure that your products are well-positioned to capture attention and increase loyalty.
6. Incorporate category growth trends.
Identify category growth trends and evolving consumer preferences that could influence shelf space decisions. For example, if certain subcategories (e.g., organic, sustainable, or health-focused products) are growing faster than others, allocate more space to these products to capitalize on shifting demand.
7. Evaluate the promotional impact on shelf space.
Assess the impact of promotions on category sales and shelf space needs. Products that consistently perform well during promotions may need additional facings or endcap displays to maximize sales during promotional periods.
Track sales uplift during promotions and adjust planograms to reflect promotional strategies.
Sales Uplift (%) = ((Sales During Promotion – Baseline Sales) / Baseline Sales) x 100
For example, if a product’s sales increase from $20,000 to $30,000 during a promotion:
Sales Uplift = (($30,000 – $20,000) / $20,000) x 100 = 50%
8. Assess competitor shelf space allocation.
Compare your product’s shelf space allocation with that of key competitors within the category.
Analyze how competitors are positioned and whether they have more favorable locations or additional facings. If competitors consistently receive better shelf placement, work with retailers to negotiate improved space for your products to remain competitive.
9. Align with retailer strategies and goals.
Collaborate with retail partners to ensure that your category management strategies align with their overall goals for category growth. Retailers may have specific objectives, such as increasing sales in health-conscious or premium product categories, and aligning your strategy with theirs can lead to stronger partnerships and better shelf space opportunities.
10. Monitor compliance and performance through in-store audits.
Conduct regular in-store audits to ensure that planograms are being followed and products are displayed according to the agreed-upon shelf space allocations. If non-compliance is identified (e.g., products are not in the correct location or do not have the agreed number of facings), address these issues with retailers to improve execution.
Format of the output of analysis:
The output of a Category Management and Shelf Space Optimization analysis typically includes:
- A breakdown of sales, profit margins, and market share by product within the category.
- Shelf space allocation recommendations based on product performance and market share.
- Insights into consumer behavior, including purchase frequency and basket size.
- Analysis of category growth trends and their impact on shelf space needs.
- Promotional impact data, highlighting how promotions affect product performance and space allocation.
- Competitor benchmarking data showing differences in shelf space allocation and positioning.
- Recommendations for adjusting planograms and improving compliance with merchandising agreements.
- Alignment with retailer-specific category strategies and goals.
How to interpret results:
- High sales and profitability with optimal shelf space: Products that generate high sales and strong margins should be prioritized for prime shelf placement and additional facings. Ensure that these products are positioned at eye level or on endcaps to maximize visibility.
- Low sales with significant shelf space: If underperforming products occupy a large amount of shelf space, consider reallocating space to higher-performing products. Reduce facings or reposition these products to free up valuable shelf space for more profitable SKUs.
- Growing subcategories with limited space: If category growth trends show increased consumer demand for specific product types (e.g., organic, premium), ensure that these products receive more space. Failing to allocate enough space to growth segments could result in missed sales opportunities.
- Competitor products receive better placement: If competitors consistently have more favorable shelf placement or more facings, work with retailers to negotiate better shelf space for your products. Highlight your brand’s market share, sales performance, and promotional plans to strengthen your case for improved placement.
Steps a company can take to improve on this measure:
- Focus on high-performing products: Prioritize top-performing products for prime shelf space and increased facings. This ensures that the products driving the most sales and profitability are highly visible to consumers.
- Adjust planograms based on consumer trends: Continuously update planograms to reflect evolving consumer preferences and category growth trends. Allocate more space to products in growing subcategories (e.g., health-conscious or premium items).
- Collaborate closely with retailers: Work closely with retailers to align category management strategies with their goals. Jointly develop category plans that drive both product and category growth, leading to stronger shelf space agreements and promotional support.
- Use data to negotiate better shelf space: Leverage sales data, market share, and profitability metrics to negotiate improved shelf space with retailers. Demonstrate how your products contribute to category growth and consumer satisfaction to secure better positioning.
- Regularly audit compliance: Conduct in-store audits to ensure that products are displayed according to planograms. Address non-compliance issues with retailers to maintain consistency in execution and maximize the effectiveness of your shelf space strategy.
Request the PDF Download of How to Analyze a Consumer Packaged Goods Company
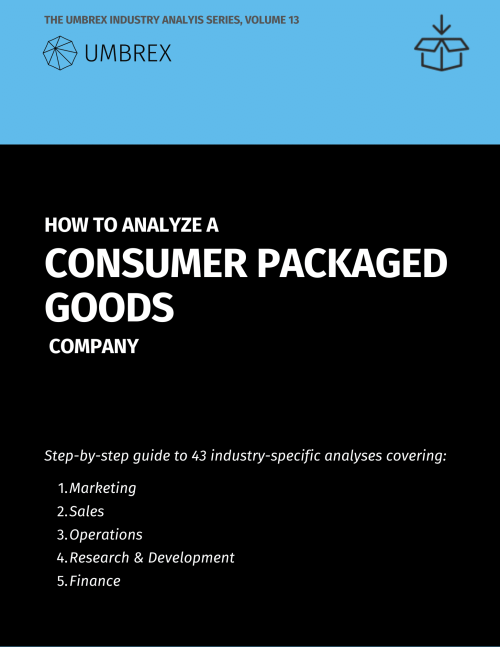
Menu of the 43 analyses:
A. MARKETING
- Brand Portfolio Analysis
- Consumer Behavior and Segmentation Analysis
- Consumer Loyalty and Retention Analysis
- Marketing Mix Effectiveness (4Ps)
- Ethnic and Multicultural Consumer Segment Analysis
- Product Reformulation and Ingredient Cost Trade-off Analysis
- Consumer Advocacy and Brand Perception Tracking
- Shopper Marketing and Path-to-Purchase Insights
- Consumer Sentiment and Social Listening Analysis
- Consumer Demand Shaping through Marketing Campaigns
B. SALES
- Channel Strategy Assessment
- Direct-to-Consumer Channel Performance
- Promotional Pricing and Discount Depth Analysis
- Retailer Relationship and Negotiation Power Assessment
- Retailer-Specific Marketing and Joint Business Planning
- Trade Promotion Effectiveness
- Shelf Availability and Out-of-Stock Analysis
- In-store Execution and Merchandising Compliance Analysis
- Category Management and Shelf Space Optimization
- In-store Sampling and Shopper Activation Effectiveness
- Price-Pack Architecture Optimization
- Private Label Cannibalization and Erosion Impact
C. OPERATIONS
- Product Mix and SKU Rationalization
- Supply Chain Efficiency and Distribution Network Analysis
- Co-packing and Contract Manufacturing Evaluation
- Sourcing and Raw Material Cost Analysis
- Regional and Local Market Penetration Analysis
- Perishability and Freshness Management in Supply Chain
- End-to-End Product Traceability and Transparency Analysis
- Inventory Turns and Shelf-Life Optimization
- Distributor and Wholesaler Performance Analysis
- Distributor Margin and Channel Conflict Assessment
- Product Recall and Quality Control Analysis
D. RESEARCH & DEVELOPMENT
- Innovation Pipeline and New Product Development (NPD) Analysis
- Product Cannibalization and Cross-Selling Impact
- Product Lifecycle Management (PLM)
- Packaging and Labeling Regulatory Compliance
- Health and Wellness Trends Impact on Product Portfolio
- Global Sourcing Strategy for Commoditized Ingredients
- Sustainability and Packaging Innovation Analysis
- Brand Dilution and Extension Risk Analysis
E. FINANCE
- Trade Spend Optimization and Return on Investment (ROI)
- Product Line Profitability by Retailer Analysis