
Goal of the analysis:
The goal of a Shelf Availability and Out-of-Stock Analysis in the consumer packaged goods (CPG) industry is to assess how well a company’s products are stocked and available to consumers in retail locations. Ensuring products are consistently on shelves and minimizing stockouts is crucial for maximizing sales, maintaining brand loyalty, and supporting retail partnerships. This analysis helps identify issues related to product availability, the frequency and causes of out-of-stocks, and strategies to improve supply chain efficiency and retailer performance.
Data required:
- Sales data by store and SKU (before, during, and after stockouts)
- Retailer-specific shelf availability data (e.g., planogram compliance, product facings)
- Stockout frequency and duration data (e.g., number of days a product was unavailable)
- Inventory levels at the store and distribution center level
- Supplier and distribution lead times
- Retailer compliance reports (e.g., how well stores follow stocking plans)
- Lost sales data due to out-of-stock events (e.g., sales drop during stockouts)
- Consumer behavior data during stockouts (e.g., product switching, store switching)
- Competitor product availability data (e.g., was a competitor in stock when your product was not?)
- Feedback from retail partners and field sales teams on stock management issues
Detailed step-by-step instruction on how to conduct the analysis:
1. Define the objectives of the analysis.
Set clear goals for the shelf availability and out-of-stock analysis. These may include minimizing stockouts, improving supply chain efficiency, increasing sales by ensuring products are always available, and enhancing retailer compliance with stocking agreements.
2. Collect shelf availability and out-of-stock data.
Gather data on how often and for how long products are out of stock at the store level. Track stockout events by SKU, store, and region to identify patterns. For example, certain stores may experience more frequent stockouts due to higher demand, poor inventory management, or delayed shipments.
3. Measure out-of-stock frequency and duration.
Calculate how frequently stockouts occur and how long products remain unavailable. The formula for out-of-stock frequency is:
Out-of-Stock Frequency (%) = (Number of Days Product is Out of Stock / Total Days in Period) x 100
For example, if a product is out of stock for 10 days during 30 days:
Out-of-Stock Frequency = (10 / 30) x 100 = 33.33%
Out-of-stock duration measures how long a product remains unavailable once it runs out. Longer durations suggest issues with supply chain responsiveness or retailer replenishment processes.
4. Calculate lost sales due to out-of-stock.
Estimate how much revenue is lost when products are out of stock. One approach is to compare sales before and after stockouts to calculate the drop in revenue during the stockout period.
The formula for lost sales is:
Lost Sales = (Average Daily Sales x Number of Out-of-Stock Days)
For example, if a product sells $1,000 per day on average, and it is out of stock for 10 days:
Lost Sales = $1,000 x 10 = $10,000
This helps quantify the financial impact of out-of-stocks.
5. Analyze consumer behavior during stockouts.
Examine how stockouts affect consumer behavior. Determine whether consumers switch to a competitor’s product when yours is out of stock or if they leave the store without making a purchase. This data can be gathered through loyalty programs, point-of-sale systems, or shopper surveys.
Key questions to address include:
- Are consumers switching to a competitor’s product?
- Are consumers willing to purchase an alternative SKU within your brand?
- Do consumers go to another store to find your product?
6. Review retailer compliance and planogram adherence.
Assess whether retailers are adhering to planograms (shelf space allocation) and keeping the right number of product facings on shelves. Poor compliance can lead to products being unavailable even when they are in stock at the store.
Use shelf audits or data from retail partners to monitor how well stores are stocking your products according to the agreed-upon planogram.
7. Evaluate supply chain and inventory management.
Investigate the root causes of stockouts by analyzing the entire supply chain, from supplier lead times to in-store inventory management. Delays in production, long shipping lead times, or slow replenishment processes at distribution centers can contribute to stockouts.
Collaborate with suppliers, logistics partners, and retailers to identify bottlenecks and improve supply chain efficiency.
8. Benchmark against competitors.
Compare your product availability with that of your competitors. If your product frequently experiences stockouts while competitors remain on the shelves, this could lead to lost market share.
Assess whether competitors are better-managing inventory or if they have more favorable agreements with retailers to ensure consistent availability.
9. Examine geographic or seasonal stockout patterns.
Identify whether stockouts are more common in specific regions or during certain times of the year. Regional stockouts may be due to distribution inefficiencies, while seasonal patterns may reflect poor forecasting for peak demand periods (e.g., holidays, back-to-school, summer).
10. Collaborate with retailers to improve availability.
Share insights from the analysis with retail partners and collaborate to improve shelf availability. This could involve improving communication about stock levels, adjusting order quantities, or ensuring better compliance with planograms. Retailer-specific action plans can help resolve recurring stockout issues.
Format of the output of analysis:
The output of a Shelf Availability and Out-of-Stock Analysis typically includes:
- A breakdown of out-of-stock frequency and duration by SKU, store, and region.
- Lost sales estimates due to stockouts.
- Insights into consumer behavior during stockouts, including product switching or lost customers.
- Retailer compliance analysis, including planogram adherence and product facings.
- Supply chain and inventory management assessment, identifying potential bottlenecks.
- A comparison of product availability against key competitors.
- Seasonal or geographic patterns of stockouts.
- Recommendations for improving product availability and reducing stockouts.
How to interpret results:
- High out-of-stock frequency with significant lost sales: This indicates a major issue with product availability. Frequent stockouts lead to lost sales and frustrated customers, which may result in brand switching. Immediate action should be taken to improve inventory management and retailer compliance.
- Short out-of-stock durations with minimal sales impact: If stockouts occur infrequently and are quickly resolved, the impact on sales may be minimal. However, even short-duration stockouts can affect customer satisfaction, so efforts should still be made to minimize occurrences.
- Competitor availability is consistently better: If competitors are consistently in stock while your products experience stockouts, this is a serious competitive disadvantage. Investigate how competitors are managing their supply chain or negotiating better terms with retailers.
- Stockouts concentrated in certain regions or seasons: If stockouts are more common in specific regions or during certain times of the year, this may indicate forecasting issues or regional distribution inefficiencies. Adjust your inventory planning and distribution strategies accordingly.
Steps a company can take to improve on this measure:
- Improve supply chain visibility: Enhance visibility into inventory levels across the entire supply chain, from suppliers to retail stores. Use real-time data to track stock levels and identify potential stockout risks before they occur.
- Strengthen forecasting and demand planning: Use historical sales data and predictive analytics to improve forecasting accuracy. This can help ensure that adequate stock is available during peak demand periods, reducing the likelihood of stockouts.
- Collaborate with retailers on replenishment strategies: Work closely with retail partners to improve replenishment processes. This could involve increasing the frequency of deliveries, adjusting order quantities, or using automated replenishment systems.
- Optimize inventory levels: Balance the need for high shelf availability with the cost of holding excess inventory. Use data to set optimal inventory levels that minimize the risk of stockouts while avoiding overstocking.
- Enhance planogram compliance: Conduct regular audits to ensure that retailers are adhering to agreed-upon planograms and stocking your products with the correct number of facings. Retailer non-compliance can lead to unnecessary stockouts.
- Develop contingency plans for supply chain disruptions: Prepare for potential supply chain disruptions by creating contingency plans, such as alternative suppliers, flexible logistics options, and safety stock strategies.
Request the PDF Download of How to Analyze a Consumer Packaged Goods Company
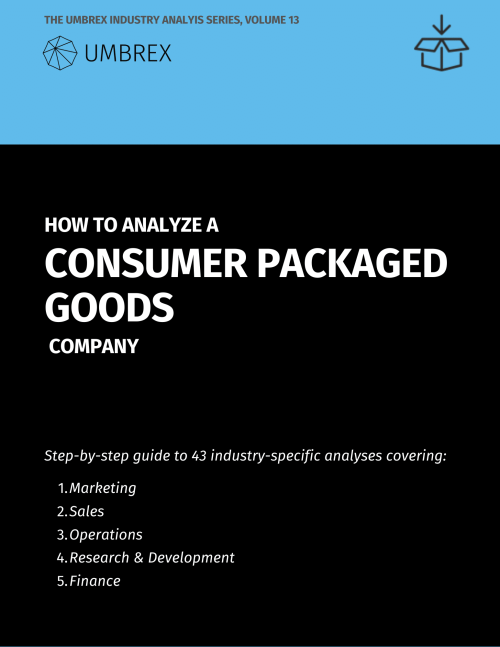
Menu of the 43 analyses:
A. MARKETING
- Brand Portfolio Analysis
- Consumer Behavior and Segmentation Analysis
- Consumer Loyalty and Retention Analysis
- Marketing Mix Effectiveness (4Ps)
- Ethnic and Multicultural Consumer Segment Analysis
- Product Reformulation and Ingredient Cost Trade-off Analysis
- Consumer Advocacy and Brand Perception Tracking
- Shopper Marketing and Path-to-Purchase Insights
- Consumer Sentiment and Social Listening Analysis
- Consumer Demand Shaping through Marketing Campaigns
B. SALES
- Channel Strategy Assessment
- Direct-to-Consumer Channel Performance
- Promotional Pricing and Discount Depth Analysis
- Retailer Relationship and Negotiation Power Assessment
- Retailer-Specific Marketing and Joint Business Planning
- Trade Promotion Effectiveness
- Shelf Availability and Out-of-Stock Analysis
- In-store Execution and Merchandising Compliance Analysis
- Category Management and Shelf Space Optimization
- In-store Sampling and Shopper Activation Effectiveness
- Price-Pack Architecture Optimization
- Private Label Cannibalization and Erosion Impact
C. OPERATIONS
- Product Mix and SKU Rationalization
- Supply Chain Efficiency and Distribution Network Analysis
- Co-packing and Contract Manufacturing Evaluation
- Sourcing and Raw Material Cost Analysis
- Regional and Local Market Penetration Analysis
- Perishability and Freshness Management in Supply Chain
- End-to-End Product Traceability and Transparency Analysis
- Inventory Turns and Shelf-Life Optimization
- Distributor and Wholesaler Performance Analysis
- Distributor Margin and Channel Conflict Assessment
- Product Recall and Quality Control Analysis
D. RESEARCH & DEVELOPMENT
- Innovation Pipeline and New Product Development (NPD) Analysis
- Product Cannibalization and Cross-Selling Impact
- Product Lifecycle Management (PLM)
- Packaging and Labeling Regulatory Compliance
- Health and Wellness Trends Impact on Product Portfolio
- Global Sourcing Strategy for Commoditized Ingredients
- Sustainability and Packaging Innovation Analysis
- Brand Dilution and Extension Risk Analysis
E. FINANCE
- Trade Spend Optimization and Return on Investment (ROI)
- Product Line Profitability by Retailer Analysis