
Goal of the analysis:
The goal of an Innovation Pipeline and New Product Development (NPD) Analysis in the consumer packaged goods (CPG) industry is to assess the effectiveness and efficiency of a company’s innovation processes, from ideation to product launch. This analysis helps CPG companies evaluate the performance of their product development pipeline, identify bottlenecks, and optimize resource allocation to ensure a steady flow of successful new products. It also focuses on aligning product innovations with consumer demand, market trends, and business objectives while minimizing risks associated with new product failures.
Data required:
- Pipeline data for all new products under development (e.g., stage-gate progress, time to market)
- Historical data on new product launches (e.g., success rates, product performance, sales growth)
- Research and development (R&D) investment data by project
- Consumer and market research data (e.g., focus group insights, consumer surveys, trend analysis)
- Competitor benchmarking for new product introductions and innovation timelines
- Revenue contribution from new products compared to existing product lines
- Product lifecycle data (e.g., product longevity, time to market saturation, decline stages)
- Risk assessment data (e.g., technical feasibility, regulatory compliance, consumer acceptance risks)
- Cross-functional collaboration metrics (e.g., coordination between marketing, R&D, manufacturing, and sales teams)
- Product performance metrics post-launch (e.g., market share, customer adoption, profitability)
Detailed step-by-step instruction on how to conduct the analysis:
1. Define the objectives of the analysis.
Establish clear goals for the innovation pipeline and NPD analysis. These may include increasing the speed of product development, improving the success rate of new product launches, aligning innovations with market demand, and maximizing return on R&D investment.
For example, a goal could be to increase the contribution of new products to overall revenue by 10% within the next two years.
2. Map the innovation pipeline.
Create a detailed map of the company’s product development pipeline, from idea generation through to commercialization.
Use a stage-gate model to evaluate the progress of each project in the pipeline, including ideation, feasibility studies, prototype development, testing, and market launch. This helps identify where bottlenecks or delays occur in the innovation process.
Stage-Gate Example:
- Stage 1: Idea generation
- Stage 2: Concept development and validation
- Stage 3: Prototype creation and testing
- Stage 4: Full product development
- Stage 5: Commercial launch
3. Analyze time-to-market metrics.
Measure the average time it takes for a new product to move from ideation to market launch. Time to market (TTM) is a critical metric for assessing innovation pipeline efficiency.
The formula for time to market is:
Time to Market (TTM) = Time from Project Start to Commercial Launch
For example, if a new product took 18 months to move from concept to launch, assess whether this time frame aligns with industry benchmarks and your internal goals.
4. Evaluate R&D investment allocation.
Review R&D investment data by project or product line to ensure resources are allocated efficiently across the innovation pipeline.
Calculate return on R&D investment (ROI) by measuring the revenue generated by new products against the R&D spend. The formula for R&D ROI is:
R&D ROI (%) = ((Revenue from New Products – R&D Costs) / R&D Costs) x 100
For example, if $2 million was spent on R&D for a product that generated $6 million in revenue:
R&D ROI = (($6 million – $2 million) / $2 million) x 100 = 200%
5. Assess consumer and market research alignment.
Evaluate how well new product concepts align with consumer demand and market trends. Review consumer research data, including focus groups, surveys, and trend analyses, to ensure that product development is driven by real consumer needs and preferences. Products developed without clear market demand are more likely to fail upon launch.
6. Track historical new product success rates.
Analyze the success rates of previous new product launches to understand what factors contributed to success or failure. Identify key performance indicators (KPIs) such as sales growth, market share, profitability, and customer adoption rates.
The success rate of new product launches can be calculated as:
Success Rate (%) = (Number of Successful Launches / Total Number of Launches) x 100
For example, if 8 out of 12 new products launched over the past two years were successful:
Success Rate = (8 / 12) x 100 = 66.7%
A high success rate indicates that the innovation pipeline is effectively producing market-ready products.
7. Perform competitor benchmarking.
Compare your innovation pipeline and product development timelines with competitors to identify areas for improvement. Track how quickly competitors bring new products to market, how frequently they launch new products, and the market share their innovations capture. Competitor benchmarking helps set realistic goals and targets for product innovation.
8. Monitor cross-functional collaboration.
Assess how well different departments (e.g., R&D, marketing, manufacturing, sales) collaborate during the NPD process. Efficient cross-functional collaboration can speed up the product development cycle and ensure alignment between product features and market needs.
Poor coordination often leads to delays, higher costs, and misalignment between product development and market requirements.
9. Identify risks in the product development process.
Conduct a risk assessment for each project in the innovation pipeline, focusing on technical feasibility, regulatory compliance, supply chain constraints, and potential consumer acceptance issues. Addressing these risks early in the development process can prevent costly delays and failures during product launch.
10. Evaluate post-launch product performance.
After a product has been launched, track its performance using KPIs such as sales growth, market share, customer adoption, and profitability. This post-launch analysis provides feedback on the effectiveness of the NPD process and helps refine future product development efforts.
Format of the output of analysis:
The output of an Innovation Pipeline and NPD Analysis typically includes:
- A detailed map of the innovation pipeline, including stage-gate progress for each product under development
- Time-to-market metrics for each product, highlighting bottlenecks and delays
- R&D investment allocation and ROI analysis for each new product
- Alignment of new product concepts with consumer research and market trends
- Historical new product success rates and performance metrics
- Competitor benchmarking data on product innovation timelines and market share
- Cross-functional collaboration evaluation to identify areas of improvement
- Risk assessment for products in the pipeline, including technical and regulatory challenges
- Post-launch performance metrics for recently introduced products
- Recommendations for optimizing the innovation pipeline, reducing time-to-market, and improving new product success rates
How to interpret results:
- Long time to market with low success rates: If time to market is long and success rates are low, this suggests inefficiencies in the NPD process. Focus on streamlining the innovation pipeline by improving cross-functional collaboration and addressing bottlenecks in the development process.
- Low R&D ROI with frequent product failures: A low return on R&D investment indicates that too much is being spent on developing products that fail to meet market needs or generate adequate revenue. Refocus R&D efforts on high-potential innovations that align more closely with consumer demand and market trends.
- Misalignment between consumer demand and new products: If new products fail to gain traction with consumers, this may indicate a disconnect between product development and market research. Ensure that consumer insights and trends drive the product ideation and development process.
- Frequent bottlenecks or delays in the innovation pipeline: Bottlenecks in the pipeline can delay product launches and cause missed market opportunities. Identify where these delays occur (e.g., in testing, marketing approval, or prototype development) and address the root causes.
Steps a company can take to improve on this measure:
- Streamline the stage-gate process: Review the stage-gate process for NPD to ensure that it is efficient and does not introduce unnecessary delays. Automate approvals, improve communication between teams, and hold regular reviews to ensure projects move smoothly from one stage to the next.
- Increase R&D focus on high-potential projects: Prioritize R&D investment in projects with the highest potential for success based on market research, consumer feedback, and trend analysis. Redirect resources away from lower-priority projects to ensure that key innovations receive the funding and attention they need.
- Enhance cross-functional collaboration: Improve communication and coordination between R&D, marketing, sales, and manufacturing teams. This ensures that product features align with market needs and that production capacity is in place to support successful launches.
- Shorten time to market: Identify bottlenecks that slow down the development process and work to reduce time-to-market. This can be done by implementing agile development practices, conducting rapid prototyping, and improving testing efficiency.
- Conduct rigorous market validation early: Validate new product concepts early in the development process through consumer testing, focus groups, and trend analysis. Products that do not meet consumer expectations should be refined or discontinued before significant investment is made.
- Monitor and iterate post-launch performance: After launching a new product, track its performance closely. Use the data collected to iterate and improve future products. This feedback loop helps ensure that future innovations are aligned with market demands and have a higher chance of success.
Request the PDF Download of How to Analyze a Consumer Packaged Goods Company
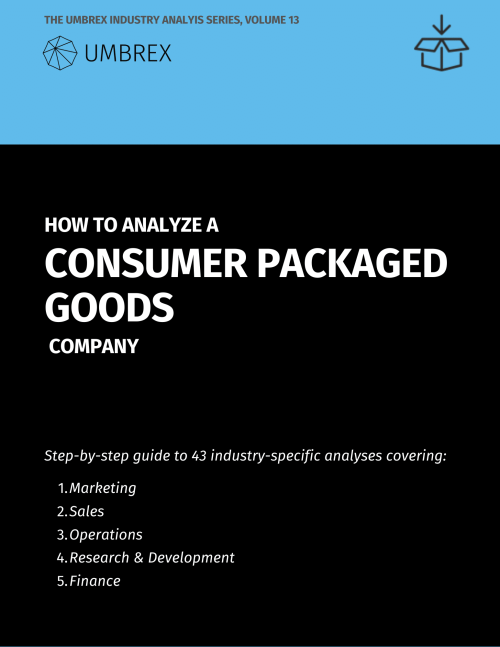
Menu of the 43 analyses:
A. MARKETING
- Brand Portfolio Analysis
- Consumer Behavior and Segmentation Analysis
- Consumer Loyalty and Retention Analysis
- Marketing Mix Effectiveness (4Ps)
- Ethnic and Multicultural Consumer Segment Analysis
- Product Reformulation and Ingredient Cost Trade-off Analysis
- Consumer Advocacy and Brand Perception Tracking
- Shopper Marketing and Path-to-Purchase Insights
- Consumer Sentiment and Social Listening Analysis
- Consumer Demand Shaping through Marketing Campaigns
B. SALES
- Channel Strategy Assessment
- Direct-to-Consumer Channel Performance
- Promotional Pricing and Discount Depth Analysis
- Retailer Relationship and Negotiation Power Assessment
- Retailer-Specific Marketing and Joint Business Planning
- Trade Promotion Effectiveness
- Shelf Availability and Out-of-Stock Analysis
- In-store Execution and Merchandising Compliance Analysis
- Category Management and Shelf Space Optimization
- In-store Sampling and Shopper Activation Effectiveness
- Price-Pack Architecture Optimization
- Private Label Cannibalization and Erosion Impact
C. OPERATIONS
- Product Mix and SKU Rationalization
- Supply Chain Efficiency and Distribution Network Analysis
- Co-packing and Contract Manufacturing Evaluation
- Sourcing and Raw Material Cost Analysis
- Regional and Local Market Penetration Analysis
- Perishability and Freshness Management in Supply Chain
- End-to-End Product Traceability and Transparency Analysis
- Inventory Turns and Shelf-Life Optimization
- Distributor and Wholesaler Performance Analysis
- Distributor Margin and Channel Conflict Assessment
- Product Recall and Quality Control Analysis
D. RESEARCH & DEVELOPMENT
- Innovation Pipeline and New Product Development (NPD) Analysis
- Product Cannibalization and Cross-Selling Impact
- Product Lifecycle Management (PLM)
- Packaging and Labeling Regulatory Compliance
- Health and Wellness Trends Impact on Product Portfolio
- Global Sourcing Strategy for Commoditized Ingredients
- Sustainability and Packaging Innovation Analysis
- Brand Dilution and Extension Risk Analysis
E. FINANCE
- Trade Spend Optimization and Return on Investment (ROI)
- Product Line Profitability by Retailer Analysis