
Goal of the analysis:
The goal of a Supply Chain Efficiency and Distribution Network Analysis in the consumer packaged goods (CPG) industry is to evaluate the performance of the supply chain and distribution network to optimize logistics, reduce costs, improve product availability, and increase overall operational efficiency. This analysis helps CPG companies identify bottlenecks, minimize inefficiencies, and streamline the flow of goods from manufacturing to retail locations, ensuring timely delivery and minimizing stockouts. Optimizing the distribution network can lead to significant cost savings and better service levels for retailers and consumers.
Data required:
- Supply chain cost data (e.g., transportation, warehousing, labor, handling costs)
- Distribution network layout (e.g., locations of manufacturing plants, warehouses, distribution centers)
- Delivery lead times and service levels for each distribution center and channel
- Inventory turnover rates and stock levels at each node in the supply chain
- Transportation efficiency data (e.g., fuel costs, vehicle utilization, route optimization)
- Supplier lead times and reliability data
- Product demand forecasts and historical sales data
- SKU performance across different distribution centers and channels
- Stockout frequency and service level performance at retail locations
- Competitor benchmarking data for supply chain and logistics efficiency
Detailed step-by-step instruction on how to conduct the analysis:
1. Define the objectives of the analysis.
Set clear objectives for the supply chain and distribution network analysis. Common goals include reducing logistics costs, improving delivery speed, increasing inventory turnover, and ensuring optimal product availability across all channels. For example, a goal could be to reduce transportation costs by 10% while maintaining or improving service levels.
2. Collect supply chain cost data.
Gather data on all supply chain-related costs, including transportation (fuel, labor, and vehicle costs), warehousing (storage, handling), and other logistics expenses. Break down these costs by segment (e.g., manufacturing to warehouse, warehouse to retail location) to identify cost drivers at each stage of the supply chain.
3. Total Supply Chain Costs can be calculated as the sum of transportation, warehousing, handling, and other logistics-related costs for the period of analysis.
4. Map the distribution network.
Create a detailed map of your current distribution network, including manufacturing plants, warehouses, and distribution centers.
Evaluate the geographic alignment of your distribution network with your key retail markets. Determine whether certain locations (e.g., warehouses or distribution centers) are underutilized or lead to unnecessary transportation distances.
Average Distance Traveled can be calculated as:
Average Distance = Total Distance Traveled by Goods / Number of Deliveries
5. Evaluate inventory turnover and stock levels.
Review inventory turnover rates and stock levels at each node in the supply chain, including warehouses and distribution centers. High inventory levels or low turnover rates may indicate inefficiencies in demand forecasting or supply chain management.
Inventory turnover can be calculated using the formula:
Inventory Turnover Ratio = Cost of Goods Sold / Average Inventory
For example, if a distribution center has $500,000 in COGS and an average inventory value of $250,000:
Inventory Turnover = $500,000 / $250,000 = 2 (indicating that inventory turns over twice in the period)
Low turnover rates indicate excess stock, while high turnover rates with frequent stockouts suggest a need for better inventory management.
6. Analyze transportation efficiency.
Assess the efficiency of your transportation operations by analyzing metrics such as fuel costs, vehicle utilization, route optimization, and delivery lead times. Inefficient transportation routes, underutilized vehicles, or high fuel costs can drive up logistics expenses.
Focus on improving vehicle load utilization and optimizing delivery routes to reduce costs and improve service levels.
Fuel Efficiency can be calculated as:
Fuel Efficiency = Total Distance Traveled / Total Fuel Consumed
7. Track delivery lead times and service levels.
Monitor delivery lead times and service levels across different distribution centers and regions. Long delivery lead times can result in stockouts and poor service levels, negatively impacting retailer and consumer satisfaction.
Track how well your distribution network meets service level agreements (SLAs) and ensure timely deliveries.
On-time Delivery Rate can be calculated as:
On-time Delivery Rate (%) = (Number of On-time Deliveries / Total Number of Deliveries) x 100
For example, if 900 out of 1,000 deliveries were on time:
On-time Delivery Rate = (900 / 1,000) x 100 = 90%
8. Assess supplier lead times and reliability.
Evaluate the performance of suppliers in delivering raw materials or finished goods to your manufacturing plants or warehouses.
Suppliers with long or inconsistent lead times can cause delays and disrupt the flow of goods. Use data on supplier performance to identify bottlenecks and negotiate improved delivery terms where necessary.
Supplier Reliability can be measured as the percentage of orders delivered on time and in full (OTIF).
9. Analyze SKU performance across distribution centers.
Review how different SKUs perform across your distribution network. Some SKUs may be overstocked in certain regions while understocked in others.
Use SKU-level performance data to adjust inventory levels and ensure that products are available where demand is highest, minimizing stockouts and excess inventory.
10. Identify stockouts and service level failures.
Track the frequency of stockouts and service level failures at retail locations. Stockouts can lead to lost sales and reduced customer satisfaction, while service level failures (e.g., late deliveries) can damage relationships with retailers.
Analyze stockout data by SKU and region to identify gaps in your distribution network.
11. Benchmark against competitors.
Compare your supply chain and distribution network performance with that of key competitors. Use benchmarking data to identify areas where competitors may have more efficient logistics operations, lower costs, or better service levels. This can inform improvements in your own network design and supply chain strategy.
Format of the output of analysis:
The output of a Supply Chain Efficiency and Distribution Network Analysis typically includes:
- A breakdown of total supply chain and logistics costs by segment (e.g., transportation, warehousing, handling).
- A detailed map of the current distribution network, highlighting potential inefficiencies (e.g., underutilized locations, excessive transportation distances).
- Inventory turnover and stock level analysis, identifying areas of excess stock or frequent stockouts.
- Transportation efficiency data, including fuel efficiency, vehicle utilization, and route optimization opportunities.
- Service level performance metrics, such as on-time delivery rates and lead time analysis.
- Supplier performance metrics, including lead times and reliability (OTIF rates).
- SKU-level performance across distribution centers, showing which products are over- or understocked.
- Competitor benchmarking data for supply chain efficiency and logistics costs.
- Recommendations for optimizing the distribution network, improving transportation efficiency, and reducing supply chain costs.
How to interpret results:
- High supply chain costs with low transportation efficiency: If your supply chain costs are high and transportation efficiency is low, focus on optimizing routes, improving vehicle utilization, and reducing transportation distances. Consider consolidating distribution centers or using third-party logistics providers to reduce costs.
- Low inventory turnover with excess stock: If inventory turnover is low and stock levels are high, it may indicate poor demand forecasting or overproduction. Adjust inventory levels based on SKU performance and forecasted demand to reduce excess stock and improve turnover.
- Frequent stockouts and poor service levels: If stockouts and service level failures are common, it may indicate inefficiencies in your distribution network or inventory management. Improve demand forecasting and ensure that high-demand SKUs are adequately stocked across distribution centers.
- Supplier lead times affecting production: If suppliers consistently fail to meet lead times or deliver incomplete orders, this can cause delays in production and distribution. Consider renegotiating terms or sourcing alternative suppliers to improve reliability.
Steps a company can take to improve on this measure:
- Optimize the distribution network layout: Reevaluate the geographic locations of warehouses and distribution centers to ensure optimal coverage of key markets. Consolidate or relocate underperforming centers to reduce transportation distances and costs.
- Improve transportation efficiency: Implement route optimization tools, increase vehicle utilization, and explore alternative transportation methods (e.g., rail or sea) to reduce transportation costs. Consider adopting greener practices to improve fuel efficiency and reduce environmental impact.
- Enhance inventory management: Use data-driven forecasting models to improve inventory turnover rates and reduce excess stock. Ensure that high-demand products are well-stocked in regions where they are most needed, while reducing overstocking in low-demand areas.
- Strengthen supplier relationships: Work with suppliers to improve lead times and reliability. Negotiate better terms for deliveries or consider alternative suppliers if current ones are underperforming. Collaborative planning with suppliers can also improve the flow of raw materials or goods.
- Increase automation and technology adoption: Invest in supply chain technology (e.g., warehouse management systems, demand forecasting tools, route optimization software) to improve operational efficiency. Automation can reduce human error and streamline processes, leading to better cost control and service levels.
- Regularly review and benchmark performance: Continuously monitor supply chain metrics, such as costs, inventory turnover, and delivery lead times. Benchmark performance against industry standards and competitors to identify areas for improvement and maintain a competitive edge.
Request the PDF Download of How to Analyze a Consumer Packaged Goods Company
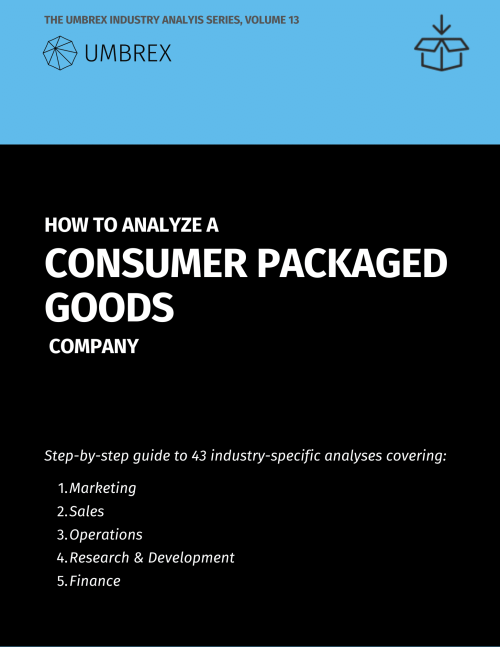
Menu of the 43 analyses:
A. MARKETING
- Brand Portfolio Analysis
- Consumer Behavior and Segmentation Analysis
- Consumer Loyalty and Retention Analysis
- Marketing Mix Effectiveness (4Ps)
- Ethnic and Multicultural Consumer Segment Analysis
- Product Reformulation and Ingredient Cost Trade-off Analysis
- Consumer Advocacy and Brand Perception Tracking
- Shopper Marketing and Path-to-Purchase Insights
- Consumer Sentiment and Social Listening Analysis
- Consumer Demand Shaping through Marketing Campaigns
B. SALES
- Channel Strategy Assessment
- Direct-to-Consumer Channel Performance
- Promotional Pricing and Discount Depth Analysis
- Retailer Relationship and Negotiation Power Assessment
- Retailer-Specific Marketing and Joint Business Planning
- Trade Promotion Effectiveness
- Shelf Availability and Out-of-Stock Analysis
- In-store Execution and Merchandising Compliance Analysis
- Category Management and Shelf Space Optimization
- In-store Sampling and Shopper Activation Effectiveness
- Price-Pack Architecture Optimization
- Private Label Cannibalization and Erosion Impact
C. OPERATIONS
- Product Mix and SKU Rationalization
- Supply Chain Efficiency and Distribution Network Analysis
- Co-packing and Contract Manufacturing Evaluation
- Sourcing and Raw Material Cost Analysis
- Regional and Local Market Penetration Analysis
- Perishability and Freshness Management in Supply Chain
- End-to-End Product Traceability and Transparency Analysis
- Inventory Turns and Shelf-Life Optimization
- Distributor and Wholesaler Performance Analysis
- Distributor Margin and Channel Conflict Assessment
- Product Recall and Quality Control Analysis
D. RESEARCH & DEVELOPMENT
- Innovation Pipeline and New Product Development (NPD) Analysis
- Product Cannibalization and Cross-Selling Impact
- Product Lifecycle Management (PLM)
- Packaging and Labeling Regulatory Compliance
- Health and Wellness Trends Impact on Product Portfolio
- Global Sourcing Strategy for Commoditized Ingredients
- Sustainability and Packaging Innovation Analysis
- Brand Dilution and Extension Risk Analysis
E. FINANCE
- Trade Spend Optimization and Return on Investment (ROI)
- Product Line Profitability by Retailer Analysis