
A PowerPoint deck with 200+ slide templates you can customize for your own practice
Independent consultants frequently ask how to create PowerPoint presentations. This 3rd edition resource includes PowerPoint templates and themes, used by more than 70,000 professionals, that you can download and customize.
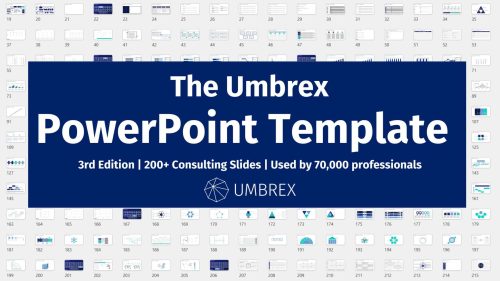
In this template deck you'll find:
Examples of various types of PowerPoint presentation slides — including bar charts, pie charts, scatter plots, data maps, concepts, and more — used by major consulting firms such as McKinsey, Bain, and BCG.
Continue navigating below to view screenshots of slides you’ll find in this deck, grouped into categories. Some are clickable, to view a page with examples of how others have used the slides.
Click here to watch a video with instructions on how to customize the templates for your own use.
Request the Umbrex PowerPoint Templates:
Function: Structural Components
The following PowerPoint presentation slides provide basic organizational structure to the presentation.
Section divider
Table of contents
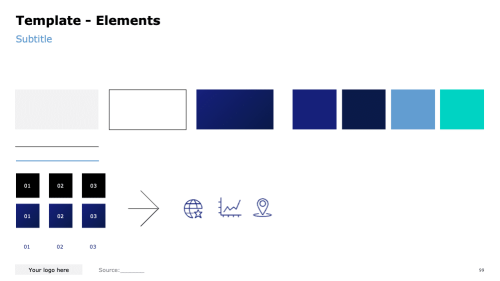
Elements slide


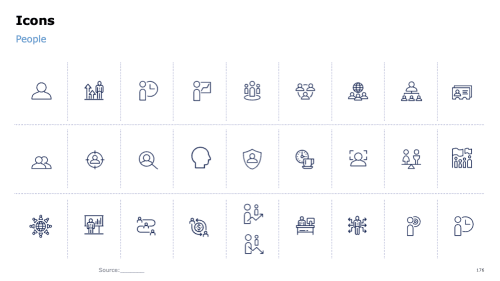
Icons
Icons

Function: Text
The following PowerPoint presentation slides function to convey information through text.
For Executive Summary slides, check out our Ultimate Guide to Executive Summary Slides.
Executive summary
Table of words
Description slide


Statements slide
Key points diagram
Statistics table


Features list
Quotes slide
SWOT analysis


Checklist
Four categories
Problem-solving checklist


Problem statement
Problem definition worksheet
Stakeholder analysis


Word cloud

Function: Quantitative Information
The following PowerPoint presentation slides are those that express quantitative data that can be counted or measured in numerical values.
Bar Charts
A bar chart displays rectangular bars, usually horizontally. Subtypes include: Clustered Bar (comparing two or more data points within each category), Stacked Bar (Bar is divided up into two or more components), or 100% Stacked Bar (each bar represents 100%).
Below you will find our PowerPoint templates of bar charts that you can customize for your use. Click on any chart image to go to a page with the full-size template download and examples of how that chart has been used by others.
Simple bar chart
Stacked bar chart
100% stacked bar chart


Clustered bar chart
Waterfall bar chart
Bar chart with words


Column Charts
Data that’s arranged in columns or rows on a worksheet can be plotted in a column chart. A column chart typically displays categories along the horizontal (category) axis and values along the vertical (value) axis. .
Below you will find our PowerPoint templates of column charts that you can customize for your use. Click on any chart image to go to a page with the full-size template download and examples of how that chart has been used by others.
Simple column chart
Stacked column chart
100% stacked column chart


Clustered column chart
Waterfall column chart
Vertical dot chart


Grouped column chart
Multiple column chart
Pyramid column chart


Combination chart
Mekko chart
Density chart


Population pyramid
Heat map
Percentage breakdown


Histogram

Line charts
Data that’s arranged in columns or rows on a worksheet can be plotted in a line chart. In a line chart, category data is distributed evenly along the horizontal axis, and all value data is distributed evenly along the vertical axis.
Below you will find our PowerPoint templates of line charts that you can customize for your use. Click on any chart image to go to a page with the full-size template download and examples of how that chart has been used by others.
Growth curve line chart
Vertical line chart
Data over time line chart


Peak line chart
Arrow line chart
Multiple line chart


Evolution line chart
Radial line chart
Line chart


Pie charts
A pie chart is a circular statistical graphic, which is divided into slices to illustrate numerical proportion. In a pie chart, the arc length of each slice is proportional to the quantity it represents.
Below you will find our PowerPoint templates of pie charts that you can customize for your use. Click on any chart image to go to a page with the full-size template download and examples of how that chart has been used by others.
Simple pie chart
Doughnut chart
Multiple doughnut chart


Harvey ball slide
Wheel chart


Area charts
Data that’s arranged in columns or rows on a worksheet can be plotted in an area chart. Area charts can be used to plot change over time and draw attention to the total value across a trend. By showing the sum of the plotted values, an area chart also shows the relationship of parts to a whole.
Below you will find our PowerPoint templates of area charts that you can customize for your use. Click on any chart image to go to a page with the full-size template download and examples of how that chart has been used by others.
Simple area chart
Proportional area chart
Rectangle area chart


Scatter charts
A scatter chart has two value axes: a horizontal (x) and a vertical (y) value axis. It combines x and y values into single data points and shows them in irregular intervals, or clusters. Scatter charts are typically used for showing and comparing numeric values, like scientific, statistical, and engineering data.
Below you will find our PowerPoint templates of scatter charts that you can customize for your use. Click on any chart image to go to a page with the full-size template download and examples of how that chart has been used by others.
Simple scatter chart
Four quadrant scatter chart
Segmented scatter chart


XY bubble chart
Dot matrix chart
Radar chart


Function: Workplan/processes
The following PowerPoint presentation slides function to convey a process or work flow.
Circular flow chart
Repeating process
Timeline


Boat chart
From-to chart
Circular process chart


Journey slide
Linear process
Snake process


Go-to-market slide
Project timeline
Customer touchpoints


Business workflow
Circular process
Road flow chart


Plans vs. actual chart
Forecast chart
Steps chart


Phases chart
Strategy chart
Decision tree


Hypothesis tree
Issue tree
Plan Analyses


Gantt chart
Customer phases
Hype cycle


Analysis plan
High-level workplan
5-week workplan


One-week workplan
Image timeline
Inflow and outflow


Function: Organization/relationships
The following PowerPoint presentation slides function to convey relationships or organizational structure.
Organizational chart
Hierarchy chart
Business systems


Many-to-one chart
Rank chart
Comparative table


Network analysis
Matrix slides


Function: Concepts
The following PowerPoint presentation slides use visual concepts to convey information.
Honeycomb chart
Challenges
Decision diagram


Funnel chart
Open book slide
Mind map


Sankey diagram
Kagi chart
Ladder chart


Questions chart
Comparison chart
Gears chart


Semicircle chart
House chart
Venn diagram


Tree diagram
Circle diagram
Bull’s eye diagram


Balance scale diagram
V diagram
Level diagram


Two-axis diagram
Three-axis diagram
Triangle concept


Pyramid concept
Pentagon concept
Hexagon concept


Four categories

Function: Consulting frameworks
The following PowerPoint presentation slides represent business frameworks frequently used by independent management consultants.
Porter’s Five Forces
Porter's Generic Strategies
Porter's Value Chain


BCG Growth Share Matrix
McKinsey 7-S Framework
GE McKinsey Matrix


Ansoff Matrix
Force Field Analysis
The 3 C’s


The 4 Ps
Profitability Framework
Blue Ocean Strategy


Value Disciplines Model
Roger’s Five Factors
SIPOC Model


PESTEL Analysis
Lafley Strategy
Three Horizons


Galbraith Star Model
Seven Degrees of Freedom for Growth


Function: Geographic maps
The following PowerPoint presentation slides use maps to convey data.
Maps showing data
Flow map
Bubble map


Choropleth map

Additional Resource: Presentation Design Services — Directory of PowerPoint Outsourcing Firms
Additional Resource: PPT Design Resources
Additional Resource: Ultimate Guide to Executive Summary Slides
