
Goal of the analysis:
Evaluate the scope, efficiency, and quality of a 3PL’s value-added services (such as kitting, assembly, returns management) and assess the effectiveness of its reverse logistics operations to enhance customer satisfaction, reduce waste, and capture additional revenue streams.
Data required:
- List of current value-added services offered (assembly, customization, returns processing, refurbishment)
- Operational process flows and SOPs for each value-added service
- Reverse logistics data (return volumes, reasons for returns, turnaround times)
- Cost and revenue breakdown for each value-added service
- Service-level agreements and performance metrics (returns processing time, accuracy, customer satisfaction)
- Historical and forecasted volumes for reverse logistics activities
Detailed step-by-step instruction on how to conduct the analysis:
- Document Current Value-Added Services:
Identify all specialized offerings beyond standard warehousing and transportation (assembly, labeling, inspection, repair). Note which customers or industries use them most frequently. - Map Reverse Logistics Processes:
Outline the end-to-end returns process, from receipt of returned goods to final disposition (resale, refurbishment, recycling). Include any inspection, repair, or disposal steps. - Gather Operational & Financial Metrics:
Compile data on turnaround times, handling costs, labor hours, and overall profitability of each value-added service. For returns, note the percentage of goods resold or repaired vs. scrapped. - Analyze Process Efficiency & Bottlenecks:
Observe where delays or errors occur (e.g., inspection backlogs, insufficient staffing). Determine if additional technology or training could streamline these services. - Assess Customer Satisfaction & Service Levels:
Review feedback, survey results, and service-level agreement adherence for reverse logistics and other value-added services. Identify any recurring complaints or missed KPIs. - Benchmark Against Industry Standards:
Compare your turnaround times, cost structures, and customer satisfaction scores to peers or industry best practices. Note any sizable gaps in service quality or efficiency. - Identify Expansion or Improvement Opportunities:
Evaluate whether offering new services (e.g., refurbishment, warranty returns management) or upgrading current ones (faster returns processing) can generate higher margins and increase customer loyalty.
Format of the output of analysis:
- A portfolio overview of current value-added services and their respective operational workflows
- A process flow diagram for reverse logistics, highlighting key performance metrics and bottlenecks
- A financial summary detailing costs, revenues, and profit margins for each service type
- A recommendations report outlining potential enhancements, new service offerings, or technology integrations
How to interpret results:
- High Returns Turnaround Efficiency: Indicates a well-organized reverse logistics program, leading to better inventory recovery and customer satisfaction.
- Underutilized Value-Added Services: Suggests marketing or operational barriers preventing more widespread customer adoption.
- Excessive Labor Costs or Delays: Points to manual processes, lack of automation, or inadequate staff training in handling specialized services.
- Low Profit Margins on Add-On Services: May reveal that pricing structures are not aligned with the true cost of providing those services, or that volumes are insufficient to leverage economies of scale.
Steps a company can take to improve on this measure:
- Streamline Reverse Logistics Processes: Implement standardized workflows, real-time tracking, and clear return authorization procedures to reduce handling time and errors.
- Invest in Specialized Training & Automation: Train teams in refurbishment or repair activities and explore automated solutions for inspection, sorting, or re-labeling.
- Develop Clear Pricing Models: Ensure that the cost of providing each value-added service is reflected accurately in customer billing to maintain healthy margins.
- Leverage Data & Analytics: Use data on return reasons and service utilization rates to fine-tune processes, predict demand for specific services, and proactively address common product issues.
- Expand Service Offerings Strategically: Pilot new or enhanced services (e.g., product customization, warranty management) based on market research and customer feedback, focusing on high-margin or high-demand areas.
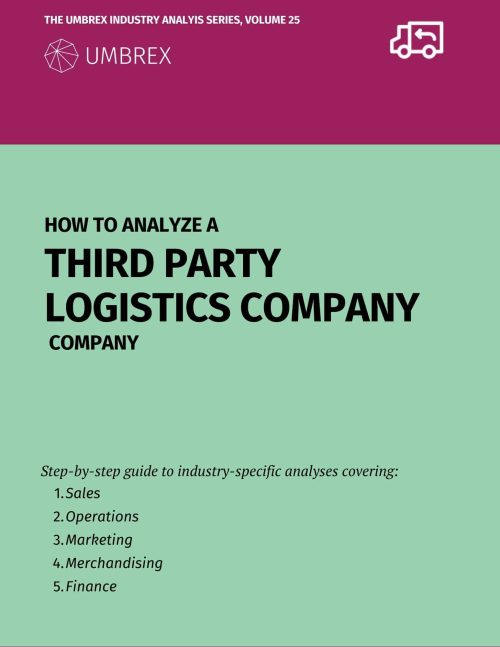
Request the PDF Download of How to Analyze a Third Party Logistics Company
Menu of the analyses:
Table of Contents
A. Transportation & Network Strategy
- Network Footprint & Capacity Utilization Analysis
- Carrier Selection & Performance Benchmarking
- Last-Mile Delivery & Final Mile Service Capabilities Analysis
- Drop Trailer & Trailer Pool Management Assessment
- Intermodal Drayage & Rail Partnership Effectiveness
- Line-Haul Network Planning & Optimization
- Freight Forwarding & 4PL Service Capability Gap Analysis
- In-Transit Merge & Consolidation Programs Efficiency Analysis
- Ocean Freight & NVOCC Partnerships Performance Review
- Backhaul Collaboration & Cross-Industry Cargo Matching Initiatives
B. Warehousing & Fulfillment
C. Technology & Systems
D. Commercial & Contractual Structures
E. Value-Added & Specialized Services
F. Trade & Regulatory Compliance
G. Strategic Growth & Resilience
H. Cost Optimization & Efficiency
I. Workforce & Labor Management