
Goal of the analysis:
Evaluate the performance and cost-efficiency of intermodal drayage operations and rail partnerships, focusing on transit times, service reliability, and overall network synergy.
Data required:
- List of rail carriers and drayage service providers
- Contract terms, rate structures, and service-level agreements
- Shipment data (origin, destination, volumes, transit times, on-time performance)
- Drayage costs, fuel surcharges, and handling fees
- Container usage (turn times, free time vs. demurrage)
- Rail transit schedules and ramp locations
Detailed step-by-step instruction on how to conduct the analysis:
- Map Current Partnerships: Identify all rail carriers and drayage providers, their service lanes, and the facilities they serve. Note any overlap or gaps in coverage.
- Collect Performance Metrics: Gather historical data on drayage pickup and drop-off times, on-time performance, transit durations, and any demurrage or detention fees incurred.
- Calculate On-Time Delivery Rates: Assess punctuality for intermodal shipments. Example formula: On-Time Drayage Delivery Rate = (On-Time Drayage Moves / Total Drayage Moves) x 100 Repeat similarly for rail on-time performance if available.
- Analyze Cost Efficiency: Compare drayage and rail costs to alternative modes. Incorporate fuel surcharges, handling fees, and rail ramp charges to understand the total cost per load or per mile.
- Review Container Turn Times: Determine how quickly containers are cycled from pickup to drop-off. Look for patterns in extended dwell times or delays at ramps and yards.
- Examine Service Reliability & Communication: Evaluate the effectiveness of communication between drayage providers, rail carriers, and the 3PL’s operations team, including load handoff procedures and issue escalation protocols.
- Benchmark Against Competitors & Industry Standards: Compare service metrics (transit times, cost per mile, on-time delivery) to competitive benchmarks or known market averages.
Format of the output of analysis:
- A summary table ranking drayage providers and rail carriers by cost, on-time rate, and transit time
- Charts showing container turn times and average dwell times at rail ramps
- A cost breakdown (per load or per mile) for intermodal shipments vs. alternative modes
- A concise report highlighting key performance gaps and recommended partnership optimizations
How to interpret results:
- High On-Time Delivery Rate (> 95 percent): Suggests strong coordination with drayage and rail providers, indicating reliability.
- Prolonged Container Turn Times: May signal congestion at rail ramps, inadequate scheduling, or poor yard management.
- High Drayage or Rail Costs: Could reveal suboptimal contract terms, inefficiencies in route planning, or limited provider competition in a region.
- Low Service Reliability: Often points to communication breakdowns, inconsistent capacity, or poor scheduling alignment between drayage and rail operations.
Steps a company can take to improve on this measure:
- Optimize Scheduling: Coordinate pickup and delivery windows more precisely with drayage providers and rail schedules to reduce wait times.
- Enhance Communication: Implement integrated systems or EDI connections for real-time visibility, improving handoffs between drayage and rail partners.
- Negotiate Better Contracts: Use performance data to renegotiate terms or explore alternative providers, targeting more favorable rates or SLAs.
- Streamline Container Management: Reduce dwell times by pre-planning container allocations, automating yard checks, and enforcing strict turnaround protocols.
- Leverage Multiple Providers: Diversify rail and drayage partnerships to mitigate capacity shortages and encourage competitive pricing.
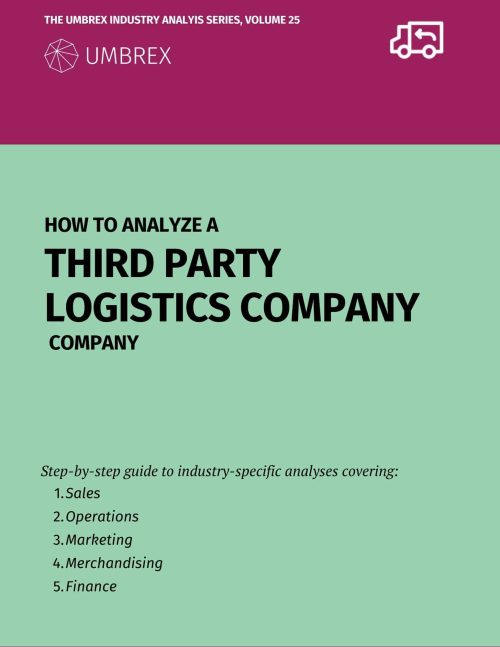
Request the PDF Download of How to Analyze a Third Party Logistics Company
Menu of the analyses:
Table of Contents
A. Transportation & Network Strategy
- Network Footprint & Capacity Utilization Analysis
- Carrier Selection & Performance Benchmarking
- Last-Mile Delivery & Final Mile Service Capabilities Analysis
- Drop Trailer & Trailer Pool Management Assessment
- Intermodal Drayage & Rail Partnership Effectiveness
- Line-Haul Network Planning & Optimization
- Freight Forwarding & 4PL Service Capability Gap Analysis
- In-Transit Merge & Consolidation Programs Efficiency Analysis
- Ocean Freight & NVOCC Partnerships Performance Review
- Backhaul Collaboration & Cross-Industry Cargo Matching Initiatives
B. Warehousing & Fulfillment
C. Technology & Systems
D. Commercial & Contractual Structures
E. Value-Added & Specialized Services
F. Trade & Regulatory Compliance
G. Strategic Growth & Resilience
H. Cost Optimization & Efficiency
I. Workforce & Labor Management