
Interactive Data Exploration Tools enable independent consultants to analyze and visualize complex datasets in real-time, offering dynamic exploration capabilities. These tools allow users to interact with data, filter views, and create custom visualizations, fostering a deeper understanding of trends and patterns.
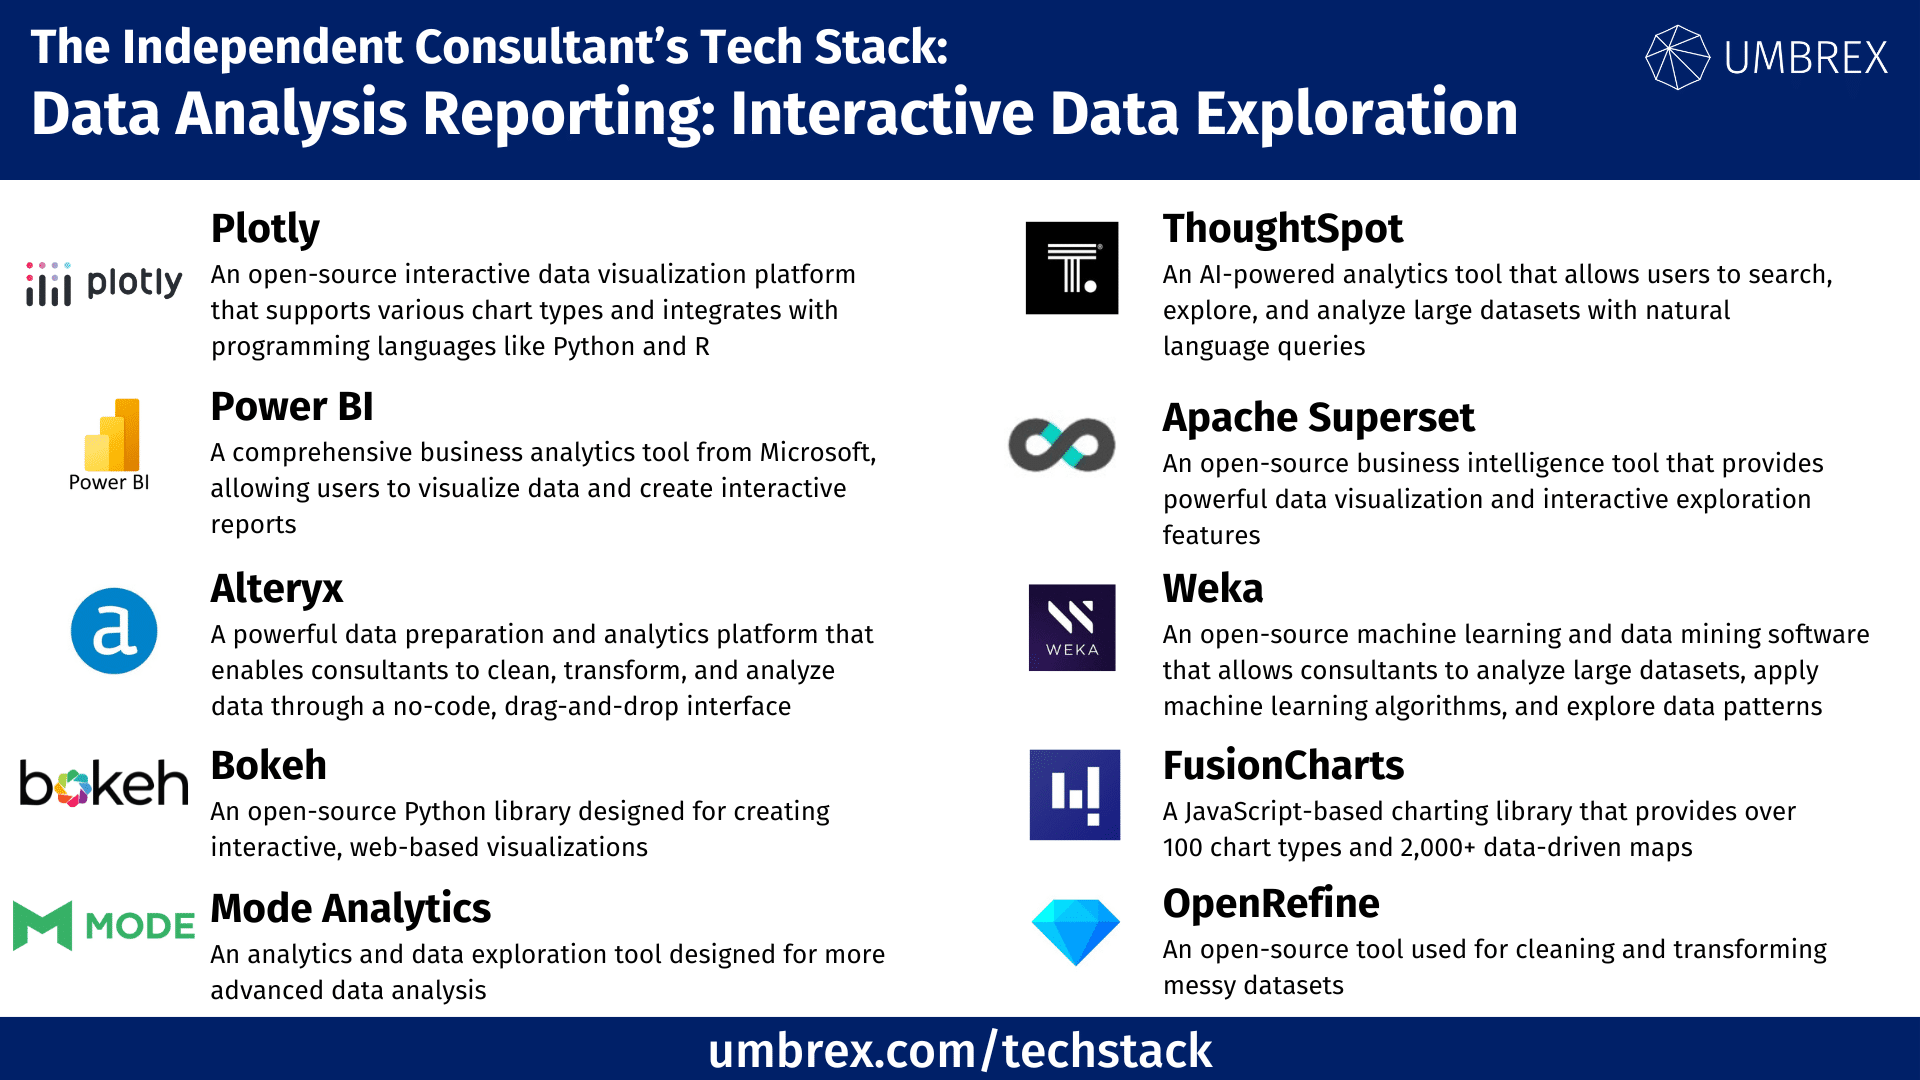
If you would like to suggest a tool to add to this resource, please send us your recommendation.
1. Plotly
- Website: www.plotly.com
- Form of tool: Web-based platform
- Cost: Free; paid plans start at $59/month
- Geographic coverage: Global
Description and Features:
Plotly is an open-source interactive data visualization platform that supports various chart types and integrates with programming languages like Python and R. It enables consultants to build complex, interactive dashboards for data exploration.
Key Features:
- Interactive visualizations and charts
- Python, R, and JavaScript integrations
- Customizable dashboards
- Collaboration features
Pros for Independent Consultants:
- Free for basic usage
- Strong support for technical users
- Excellent interactive capabilities
Cons for Independent Consultants:
- Steep learning curve for non-technical users
- Limited templates for beginners
2. Power BI
- Website: www.powerbi.microsoft.com
- Form of tool: Desktop app, web-based platform
- Cost: Free; paid plans start at $9.99/user/month
- Geographic coverage: Global
Description and Features:
Power BI is a comprehensive business analytics tool from Microsoft, allowing users to visualize data and create interactive reports. Its user-friendly interface and advanced AI-powered insights make it a popular choice for independent consultants managing various data sources.
Key Features:
- Drag-and-drop report building
- Real-time dashboards and reports
- Integration with Excel and cloud data services
- AI-driven insights
Pros for Independent Consultants:
- Affordable for small businesses
- Easy integration with other Microsoft products
- Extensive support and community resources
Cons for Independent Consultants:
- Limited customization on free plan
- Complex for beginners
3. FusionCharts
- Website: www.fusioncharts.com
- Form of tool: Web-based platform, JavaScript charting library
- Cost: Paid plans start at $497/year for individual developers
- Geographic coverage: Global
Description and Features:
FusionCharts is a JavaScript-based charting library that provides over 100 chart types and 2,000+ data-driven maps. It’s designed for creating interactive, responsive visualizations that can be embedded into websites or applications, making it ideal for consultants who need custom visuals.
Key Features:
- Wide variety of charts and maps
- Integration with frameworks like Angular, React, and Vue
- Export options for PDF, PNG, and other formats
- Real-time data updates for interactive dashboards
Pros for Independent Consultants:
- Highly customizable visualizations
- Extensive chart and map library
- Responsive designs for web and mobile
Cons for Independent Consultants:
- Higher cost for individual users
- Requires some coding knowledge
4. Bokeh
- Website: www.bokeh.org
- Form of tool: Open-source Python library
- Cost: Free
- Geographic coverage: Global
Description and Features:
Bokeh is an open-source Python library designed for creating interactive, web-based visualizations. It’s particularly useful for consultants familiar with Python, as it enables the development of complex dashboards and data-driven applications with interactive features.
Key Features:
- Supports real-time data updates and interactivity
- Customizable visualizations with built-in Python integration
- Integration with popular Python tools like Pandas and NumPy
- Can generate standalone HTML files for easy sharing
Pros for Independent Consultants:
- Free and open-source
- Excellent for Python developers and data scientists
- Supports interactive, real-time data visualizations
Cons for Independent Consultants:
- Requires Python programming knowledge
- Not as user-friendly for non-technical users
5. Mode Analytics
- Website: www.mode.com
- Form of tool: Web-based platform
- Cost: Free for individuals; custom pricing for teams
- Geographic coverage: Global
Description and Features:
Mode Analytics is an analytics and data exploration tool designed for more advanced data analysis. It supports SQL, Python, and R, making it a powerful option for consultants working with complex datasets. Mode enables the creation of interactive dashboards and data visualizations with real-time collaboration features.
Key Features:
- Support for SQL, Python, and R for data analysis
- Interactive dashboards and reports
- Real-time collaboration for teams and clients
- Custom visualizations with advanced analytics capabilities
Pros for Independent Consultants:
- Free individual plan available
- Ideal for data-savvy consultants
- Strong collaboration features
Cons for Independent Consultants:
- Requires knowledge of SQL or coding
- May be overkill for simpler data exploration needs
6. ThoughtSpot
- Website: www.thoughtspot.com
- Form of tool: Web-based platform
- Cost: Custom pricing based on business needs
- Geographic coverage: Global
Description and Features:
ThoughtSpot is an AI-powered analytics tool that allows users to search, explore, and analyze large datasets with natural language queries. It’s designed for consultants who need to extract insights from big data quickly, without needing deep technical expertise.
Key Features:
- AI-driven search and data exploration
- Real-time data analysis
- Natural language query interface
- Customizable dashboards and visualizations
Pros for Independent Consultants:
- Easy to use with natural language queries
- Strong AI and machine learning capabilities
- Fast data exploration with real-time insights
Cons for Independent Consultants:
- Custom pricing can be expensive
- Not as customizable as some other platforms
7. Apache Superset
- Website: www.superset.apache.org
- Form of tool: Open-source platform
- Cost: Free
- Geographic coverage: Global
Description and Features:
Apache Superset is an open-source business intelligence tool that provides powerful data visualization and interactive exploration features. It’s suitable for consultants who need to create interactive dashboards and analyze large datasets in real time.
Key Features:
- Interactive visualizations and customizable dashboards
- Integration with a wide variety of data sources
- Open-source and free to use
- SQL support for advanced querying
Pros for Independent Consultants:
- Free and highly customizable
- Supports large-scale datasets
- Excellent for consultants familiar with SQL
Cons for Independent Consultants:
- Requires technical knowledge to set up and customize
- Not as user-friendly as commercial tools
8. Alteryx
- Website: www.alteryx.com
- Form of tool: Desktop software, web-based platform
- Cost: Custom pricing
- Geographic coverage: Global
Description and Features:
Alteryx is a powerful data preparation and analytics platform that enables consultants to clean, transform, and analyze data through a no-code, drag-and-drop interface. It’s ideal for independent consultants who need to process large datasets and create data-driven reports without requiring coding skills.
Key Features:
- No-code interface for data preparation and analysis
- Predictive analytics and machine learning capabilities
- Integration with multiple data sources
- Data visualization and reporting tools
Pros for Independent Consultants:
- No-code platform for non-technical users
- Comprehensive data preparation and analytics features
- Strong integration with third-party tools
Cons for Independent Consultants:
- High cost for advanced features
- Can be overkill for simple analysis tasks
9. Weka
- Website: www.waikato.ac.nz/ml/weka
- Form of tool: Open-source desktop software
- Cost: Free
- Geographic coverage: Global
Description and Features:
Weka is an open-source machine learning and data mining software that allows consultants to analyze large datasets, apply machine learning algorithms, and explore data patterns. It’s ideal for consultants who need powerful data exploration tools with a focus on predictive analytics.
Key Features:
- Machine learning algorithms for predictive analytics
- Data preprocessing, clustering, and classification tools
- Open-source and free to use
- Support for visual data exploration
Pros for Independent Consultants:
- Free and open-source
- Strong machine learning capabilities
- Excellent for predictive modeling
Cons for Independent Consultants:
- Requires technical expertise to use effectively
- Limited visualization capabilities compared to other tools
10. OpenRefine
- Website: www.openrefine.org
- Form of tool: Open-source desktop software
- Cost: Free
- Geographic coverage: Global
Description and Features:
OpenRefine is an open-source tool used for cleaning and transforming messy datasets. It’s particularly useful for consultants who need to explore and refine complex datasets before analysis. While it’s not a visualization tool, it’s a powerful resource for data preparation and exploration.
Key Features:
- Data cleaning and transformation
- Handles large datasets with ease
- Free and open-source
- Supports various data formats
Pros for Independent Consultants:
- Excellent for data cleaning and preparation
- Free and easy to use
- Handles messy, complex datasets well
Cons for Independent Consultants:
- Not designed for data visualization
- Limited to data preparation tasks